Wikimedi'Òc
Modes d'emploi

Cet album fait partie des albums
Cet album photos contient les sous-albums suivants :


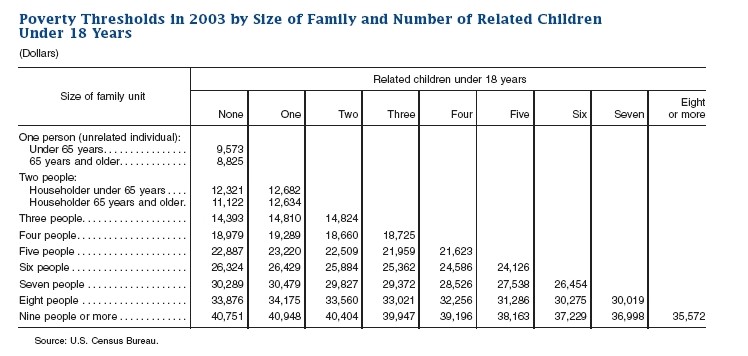
Povertythresholds-census2003.jpg - RTCEarly

AdjustedWageShareUSAFRGJapan.PNG - Alex1011
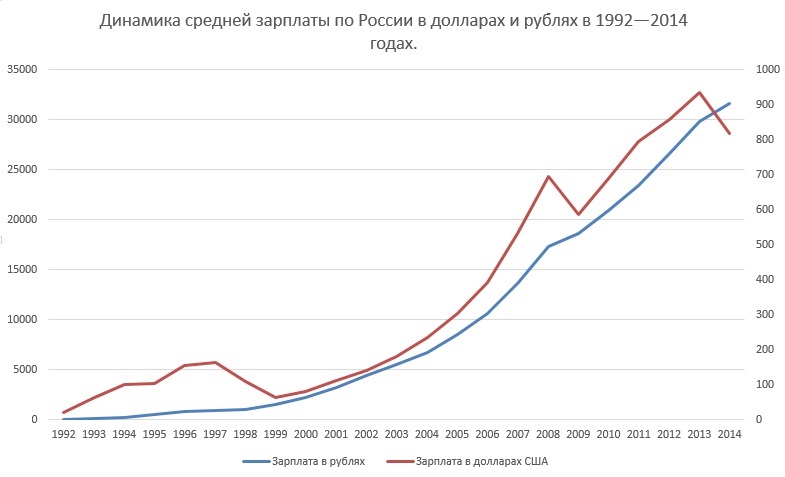
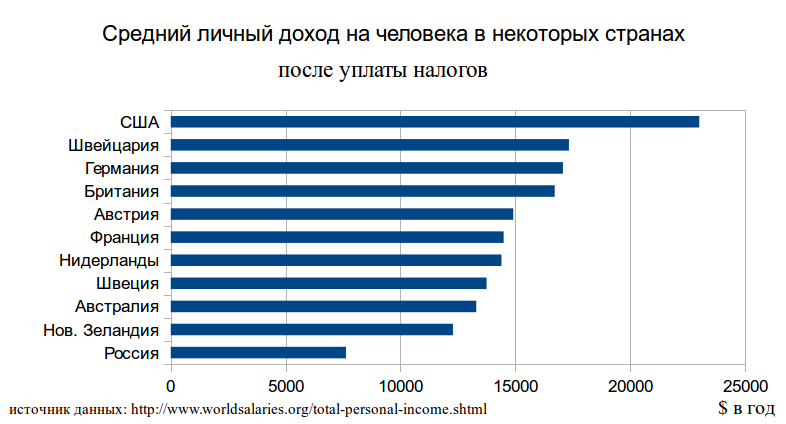
Russia's wages.jpg - АндрейХьюстон

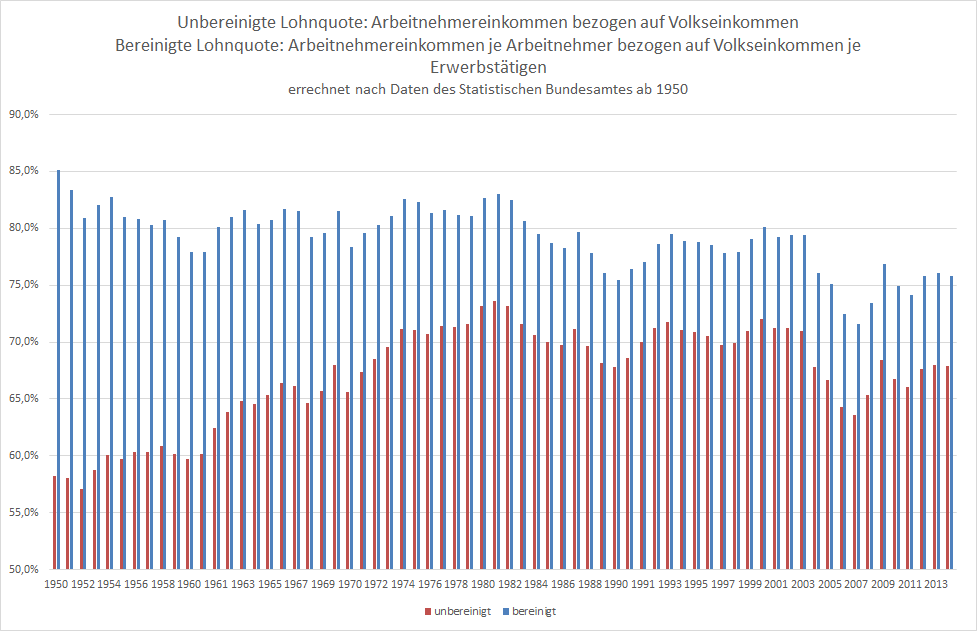
LohnquUSAJBRD1.PNG - Alex1011

LohnquUSAJBRD2.PNG - Alex1011

Ranglijst hoge inkomens.png - SieBot

Cumul allocation revenus.svg - Emmanuel.boutet

EONIA Interbankensatz 2007.JPG - Eon-ia
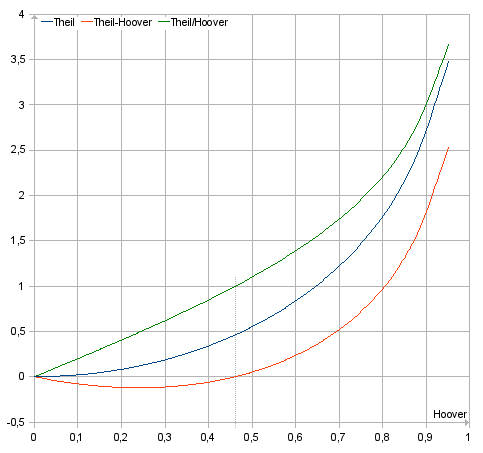
Theil Hoover.jpg - DL5MDA

HistofLeavebyCountry.png - Seabhcan~commonswiki
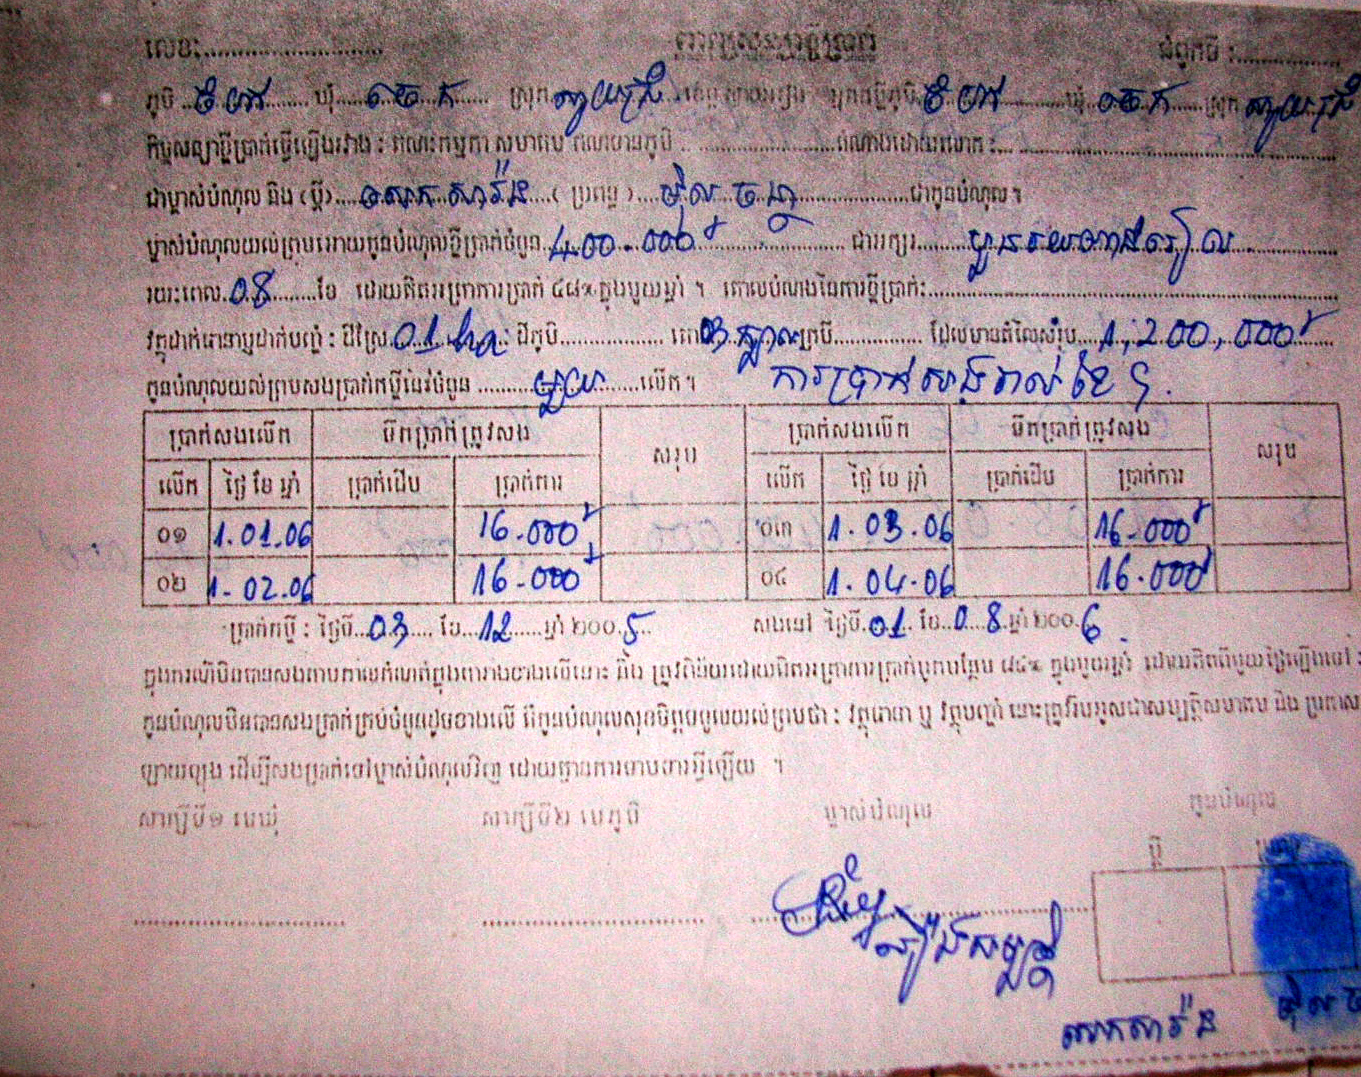
Example of Flat Rate Loan Contract Chambak, Cambodia.JPG - Brett epic

Deadweight-loss-price-ceiling.svg - Xavier Dengra

Lohnquote Deutschland 1970 bis 2000.png - Nachcommonsverschieber
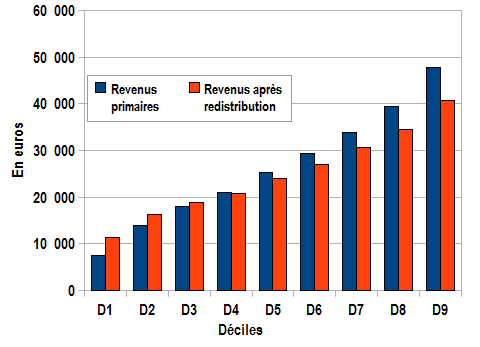
Effet redistribution.png - Gedefr

Part salaire top 1 et 10 france.png - Gedefr
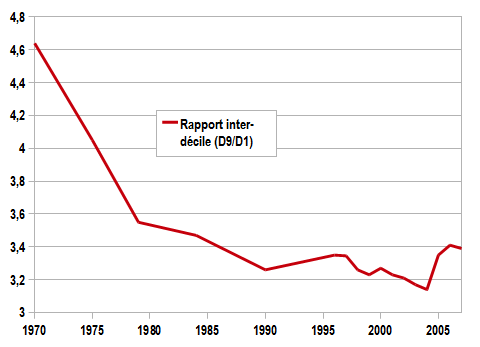
Rapport interdécile france.png - Gedefr

Composition revenu ménage france.png - Gedefr

Social indifference curves small.png - File Upload Bot (Magnus Manske)

Velfærdmodel.JPG - MGA73bot

Nominal GDP IMF 2008 millions of USD.jpg - Aaker

Lilly Ledbetter DNC 2008.jpg - Blargh29

Dia festivo.jpg - Linxelor

UsuryDurer.jpg - JayCubby

Social-expenditures-2001-OCSE.png - Marco Guzman, Jr

Deadweight-loss-price-ceiling es.svg - Jeffrey Kim

Wages in gdansk2.png - Volunteer Marek

Land Labour Graph.jpg - Tejal.johri
America Needs to Occupy Together.pdf - Anderose

Distribución ingresos autónomos Chile 2006-2009.svg - B1mbo

Asignación Universal por Hijo.jpg - SreeBot

Wage growth rates.JPG - Mzeleny
Atkinson.pdf - Valmat

RealCompEmpl.png - Alex1011

Arbeitsentgelte.png - Alex1011

Perteseche.svg - Valmat

BerLohnquUSABRDJapan.PNG - Alex1011
Personal income diag.png - Sandegud
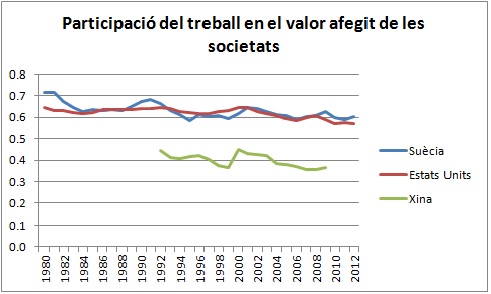
Participacio treball.jpg - Sajolida

DIFFERENCE SALAIRES HOMME FEMME.jpg - Bachelor RH
LohnquoteBRD50plus.png - Alex1011

SCB och Sveriges Ingenjörer, Reallöneutveckling i Sverige, år 1980-2012.png - John Barnham

Household income distribution in Japan.svg - Delphi234

Income distribution in Japan by sex.svg - Delphi234

Household income distribution in Japan-2009.svg - Delphi234

Spain household income.svg - Delphi234

Italy household income.svg - Delphi234

Germany household income.svg - Delphi234

Venezuela poverty percentages.svg - Delphi234
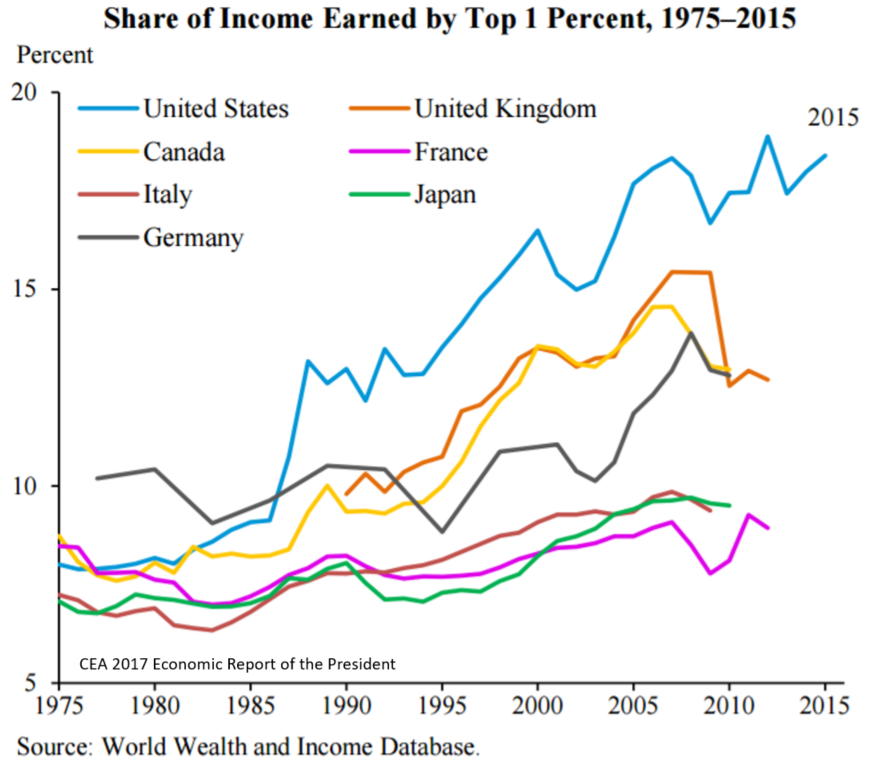
Income inequality - share of income earned by top 1% 1975 to 2015.png - Farcaster
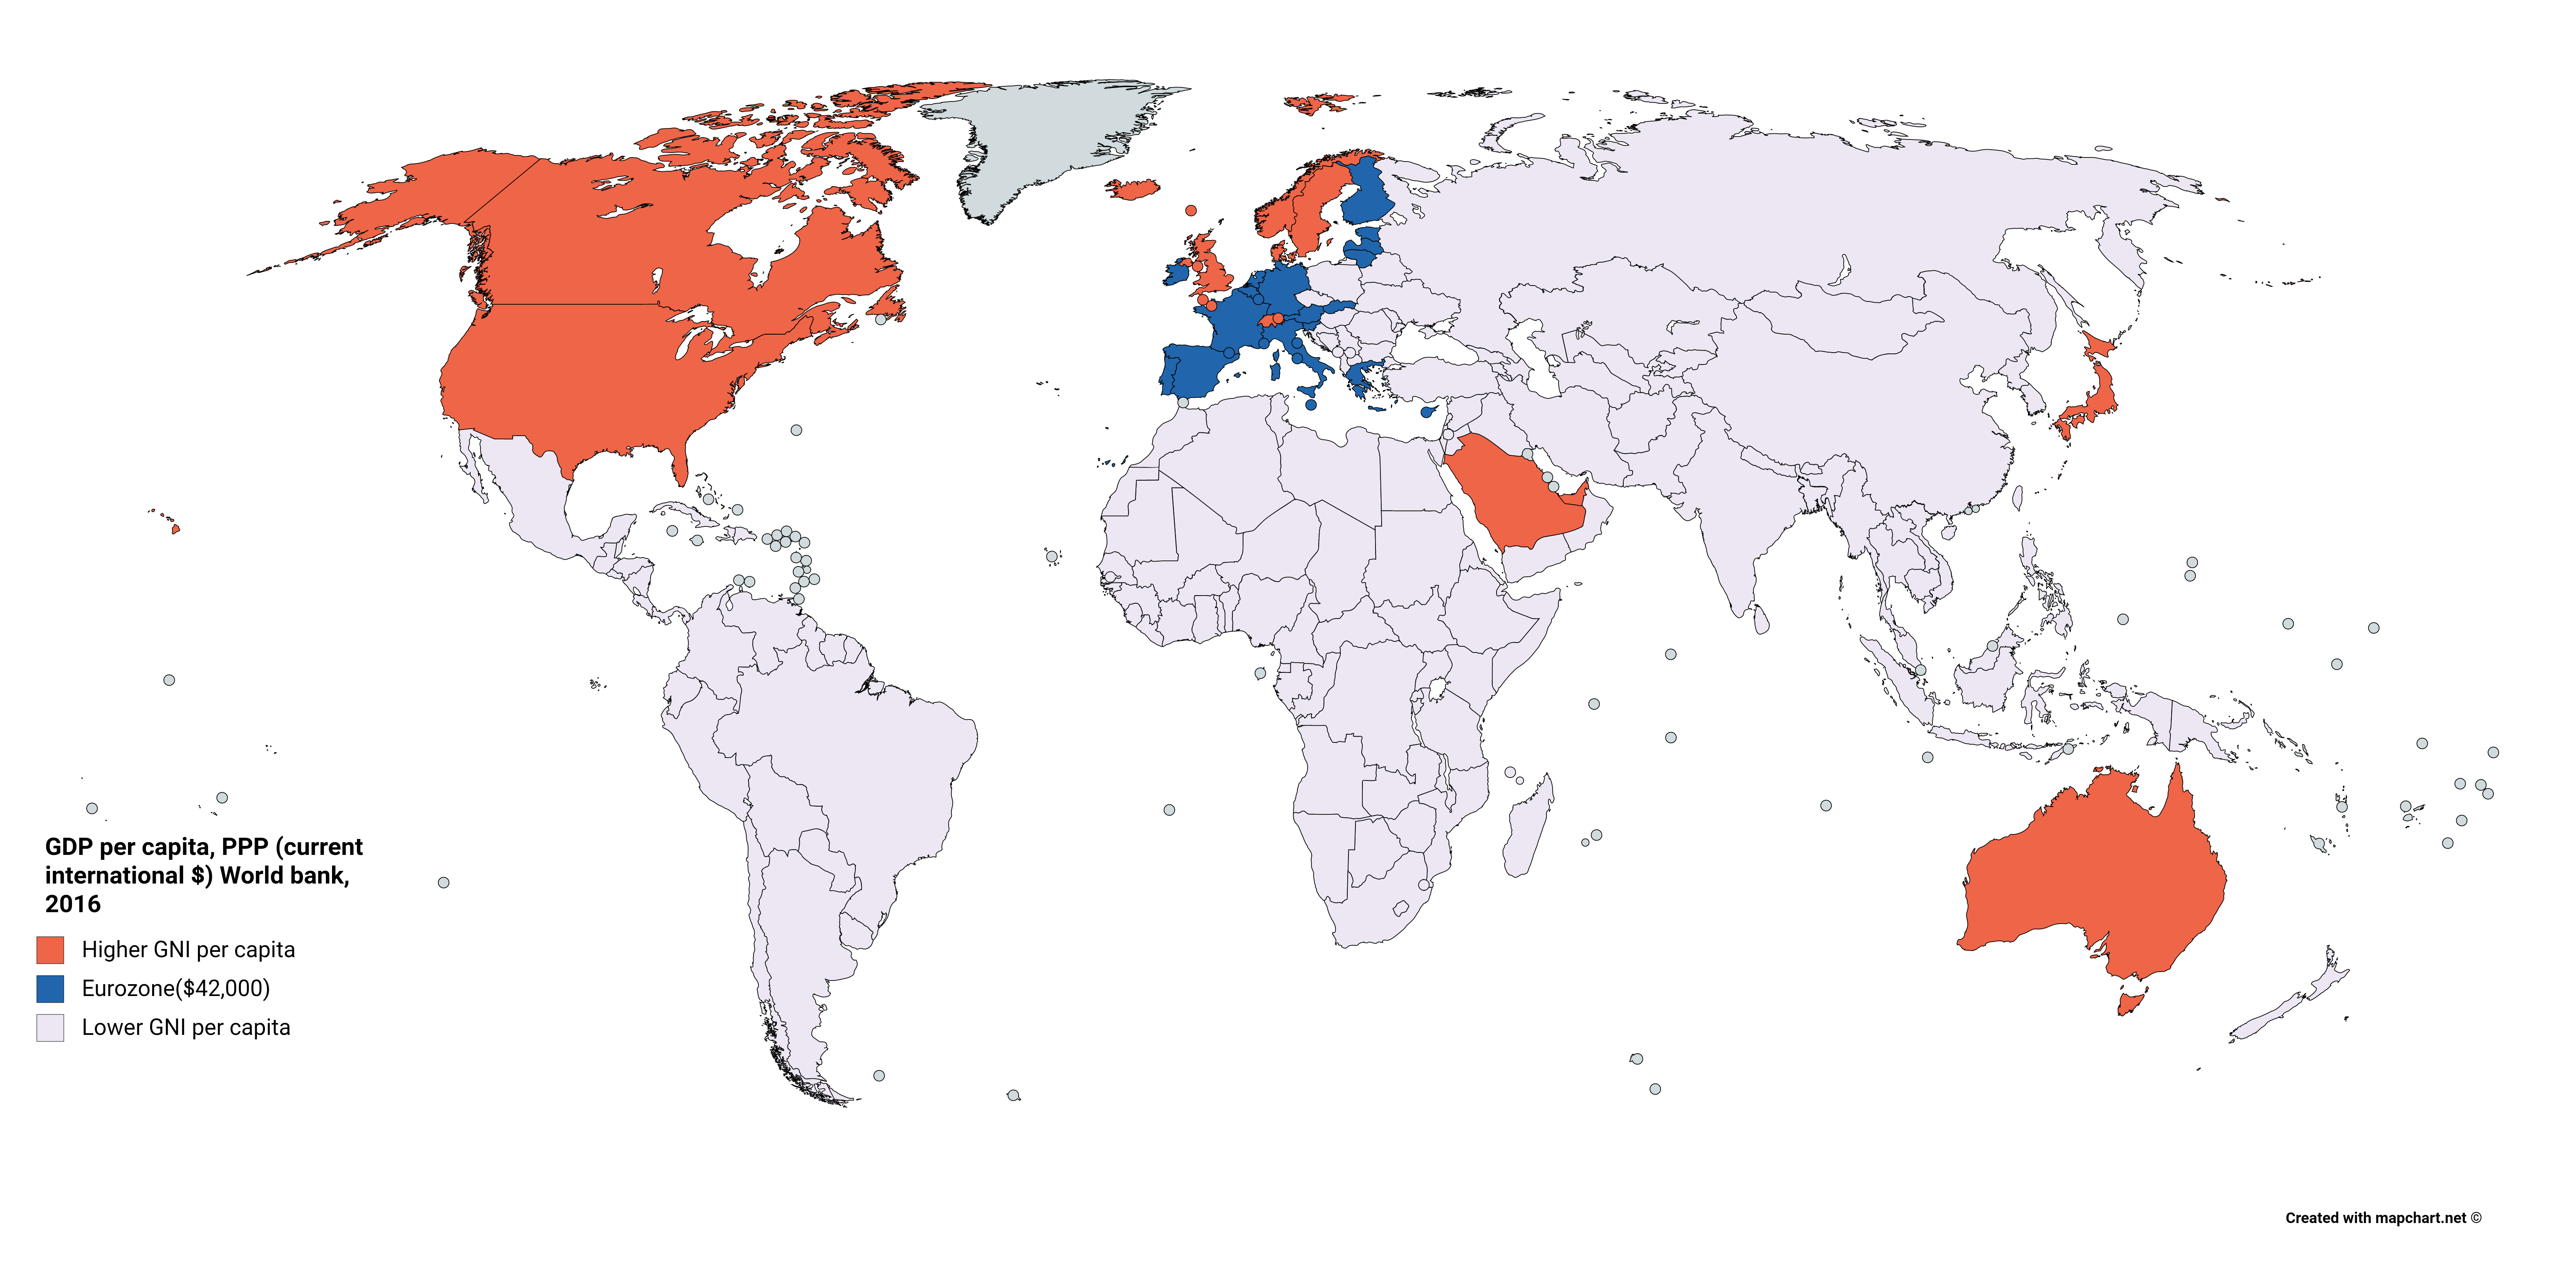
GDP per capita, PPP (current international $) World bank, 2016.png - Hornsebastian

GDP per capita PPP vs Palma ratio 2016.svg - TilmannR

GDP per capita PPP vs 20 to 20 ratio 2016.svg - PawełS

At-risk-of-poverty rate ireland 1995-2016.svg - Laschmi

Armutsgefährdungsquote in Frankreich, 2008-2017.svg - Mapar01

S80s20 Ungarn 0517.svg - RA inequality

Development of the S80S20 quantile share ratio for EU member states.svg - Quarter to five

S80S20 plot deutschland .svg - Sa-est-elle

S80s20 ireland 2005-2016.svg - Geogifaun

Income percentiles ireland - relative change - 1995-2016.svg - Geogifaun

Schweiz Mean und Median Einkommen.png - InequalityCH

MeanMedianSchweiz.svg - InequalityCH

Cumulative change in real hourly wages of all workers (1979-2013).png - Economic Policy Institute (EPI)

Cumulative change in real annual wages (1979-2012).png - Economic Policy Institute (EPI)

Cumulative growth in real hourly wages (2007-2014).png - Economic Policy Institute (EPI)

Cumulative percent change in real hourly wages of all workers, by wage percentile, 1979-2018.png - Economic Policy Institute (EPI)

Cumulative percent change in real hourly wages, by education, 2000-2018.png - Economic Policy Institute (EPI)

Cumulative percent change in real hourly wages, by wage group, 1979-2017.png - Economic Policy Institute (EPI)

Cumulative percent change in real hourly wages, by wage percentile, 2000-2018.png - Economic Policy Institute (EPI)
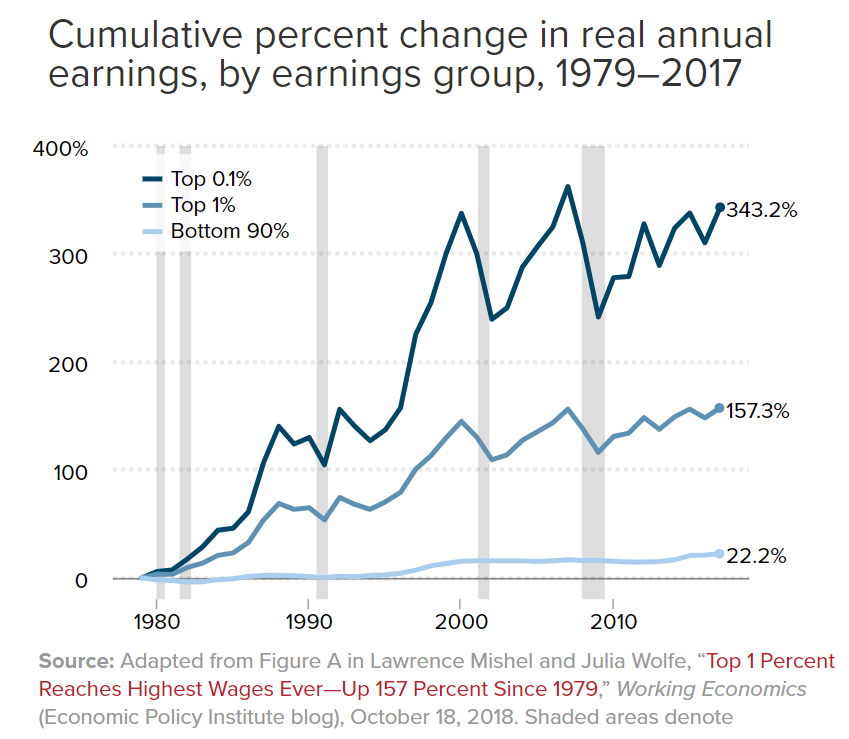
Cumulative percent change in real annual earnings, by earnings group, 1979-2017.png - Economic Policy Institute (EPI)

Risk of Poverty and Social Exclustion NUTS2 NL 2017 EUSILC.svg - Theresa.lo93
EU-wide (Equivalised) Disposable Household Income Distribution, 2014.pdf - Quarter to five

Mittelwert und Median der Einkommen in Dänemark 2003-2017, bereinigt mittels HVPI (2015=100).svg - Hkercz

Mean Median Income AT 1995-2017 EUSILC.svg - Jakob1994

Mean Median Income HU 2005-2018 EUSILC.svg - Jakob1994

Verfügbares Hauhaltseinkommen HU 2016.svg - Jakob1994

Verfügbares Hauhaltseinkommen AT 2016.svg - Jakob1994

S80S20 Einkommensquintilverhältnis nach Geschlecht Irland 2003-2017 Eurostat.svg - HeiMonThu

S80S20 Einkommensquintilverhältnis nach Geschlecht Vereinigtes Königreich 2005-2017 Eurostat.svg - HeiMonThu

S80S20neu Income Gender IE 2003-2017 EUSILC.svg - HeiMonThu

S80S20neu Income Gender UK 2005-2017 EUSILC.svg - HeiMonThu

Share of Top 10% on income in Croatia and the EU, 2010 - 2017.svg - Bachlis

Income Share of Top 10% in Croatia and the EU, 2010 - 2017.svg - Bachlis

Share of Top 10% in Croatia and neighbouring countries, 2010 - 2017.svg - Bachlis

S80S20 Einkommensquintilverhältnis in Irland 1995-2017 Eurostat.svg - HeiMonThu

S80S20 Einkommensquintilverhältnis im Vereinigten Königreich 1995-2017 Eurostat.svg - HeiMonThu

S80S20 Einkommensquintilverhältnis Vereinigtes Königreich 1995-2017 Eurostat.svg - HeiMonThu

S80S20 Einkommensquintilverhältnis Irland 1995-2017 Eurostat.svg - HeiMonThu

S80S20 Einkommensquintilverhältnis Vereinigtes Königreich 2005-2017 Eurostat.svg - HeiMonThu

Poland Median and Average Income from 2005 until 2917 EU SILC.svg - Bachlis

Top10% Income Share PL CZ DE EU LT SK 2005-2017 EUSILC.svg - Bachlis

Change in Income 1980-2014.png - Barnhorst
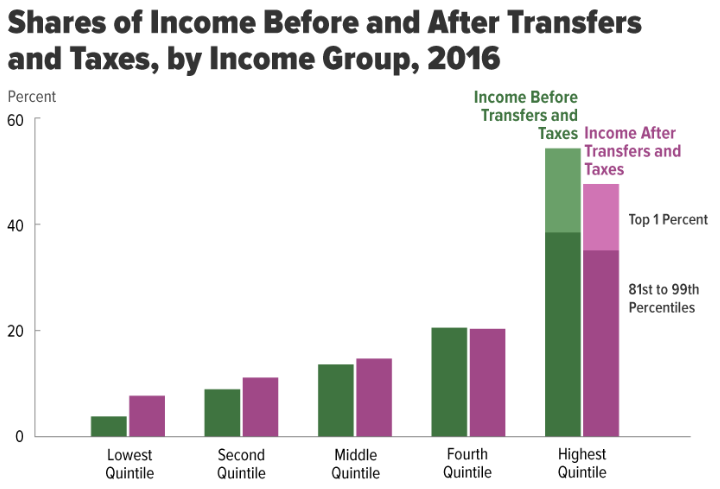
Shares of Income 2016 CBO.png - Barnhorst

Cumulative Growth in Income to 2016 from CBO.png - Barnhorst

גרף הכנסות.png - D25ab81ez

Renda per capita Brasil.png - Williamferreiraam

Individual Disposable Income (excl. NI).png - Dashing24

UK Average House Price.png - Dashing24

UK Median Gross Household Income (excl. NI).png - Dashing24

Real average annual wages in G7.svg - Yuasan

WorldBank classification 2022.svg - Furfur

Income percentiles, with median and relative poverty levels marked.png - WhatamIdoing

Average versus median US national wage graph.gif - Mrfoogles