Wikimedi'Òc
Modes d'emploi

Cet album fait partie des albums
Cet album photos contient les sous-albums suivants :


Figure 3. Labor Values, Prices of Production vs. Market Prices, China, 2000–2014.png - Artistosteles

Figure 2. Labor Values, Prices of Production vs. Market Prices, USA, 2000–2014.png - Artistosteles

Malaria-climate correlations.jpg - Robertpedley
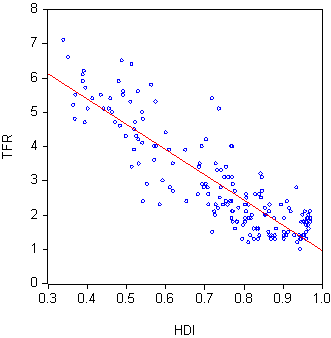
TFR HDI.PNG - Fumitakamy~commonswiki
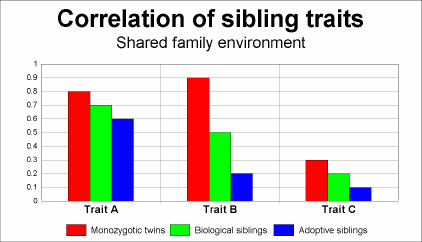
Sibling-correlation-422.png - UA31

RnD-spending-and-religiosity-in-the-world.png - Sandegud
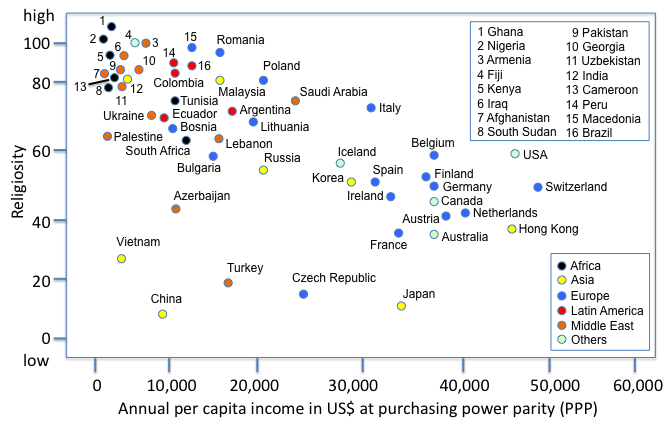
Religion economy.png - Peteruetz

PartialCorrelationGeometrically.jpg - Modern Sciences

Suicide-vs-violent-deaths.png - Wikideas1

Antibiotic use in livestock vs. meat supply per capita, OWID.svg - Fæ

Disease burden vs. health expenditure per capita, OWID.svg - Fæ

Child mortality vs per capita total health expenditure, OWID.svg - Fæ

Human Development Index vs. Corruption Perception Index, OWID.svg - Fæ

Children per woman vs. Human Development Index, OWID.svg - Fæ

Cereal crop yield vs. fertilizer application, OWID.svg - Fæ

Child Mortality vs. Health Expenditure (Gapminder), OWID.svg - Fæ

Human Development Index vs. Historical Index of Human Development, OWID.svg - Fæ

Human Development Index vs. Mean male height, OWID.svg - Fæ

Years lived with disability vs. Health expenditure per capita, OWID.svg - Fæ

Dietary land use vs. beef consumption, OWID.svg - Fæ

OECD PISA reading test score vs. UN Human Development Index, OWID.svg - Fæ

Motor vehicles per 1000 inhabitants vs GDP per capita, OWID.svg - Fæ

Healthspan, parental lifespan, and longevity are highly genetically correlated.webp - Prototyperspective

Overlap between mining and biodiversity conservation.webp - Prototyperspective

Overlap betweenmining and biodiversity conservation among critical, other and both mining areas.webp - Prototyperspective

Overlap between future population distribution and extreme heat.jpg - Prototyperspective

Per-capita-co-emissions-vs-human-development-index.svg - PJ Geest

Zusammenhang zwischen Stellenanforderungen und geschlechtsspezifischem Bewerbungspool.png - Prototyperspective

Frauen bewerben sich seltener bei Hochlohnfirmen (Bewerbungsverhalten von Frauen und Männern).png - Prototyperspective

Access-to-clean-fuels-and-technologies-for-cooking-vs-per-capita-energy-consumption (OWID 0001).png - Jason.nlw

Life-satisfaction-vs-co-emissions-per-capita (OWID 0575).png - Jason.nlw

Per-capita-consumption-based-co-emissions-vs-per-capita-energy-consumption (OWID 0777).png - Jason.nlw

Relationship between household characteristics and high per capita energy use.webp - Prototyperspective

Rate of national breastfeeding at 12 months vs per capita sales of standard CMF by country income category and the sales of CMF per capita, 2005–19.jpg - Prototyperspective

Prevalence of stunting vs. improved sanitation facilities, 2020, OWID.png - Ozzie10aaaa

Statin-use-vs-share-of-population-with-high-blood-pressure.png - Ozzie10aaaa

Perception-of-the-safety-of-vaccines-vs-vaccine-coverage.png - Ozzie10aaaa

Extreme-poverty-vs-prevalence-of-underweight-children.png - Ozzie10aaaa

Environmental impact increases with proxy measures of human group fitness (this is a problem).jpg - Prototyperspective

The-Relationship-between-the-Monetary-Value-of-UK-Industry-Outputs-and-the-Labour-Content.png - Artistosteles
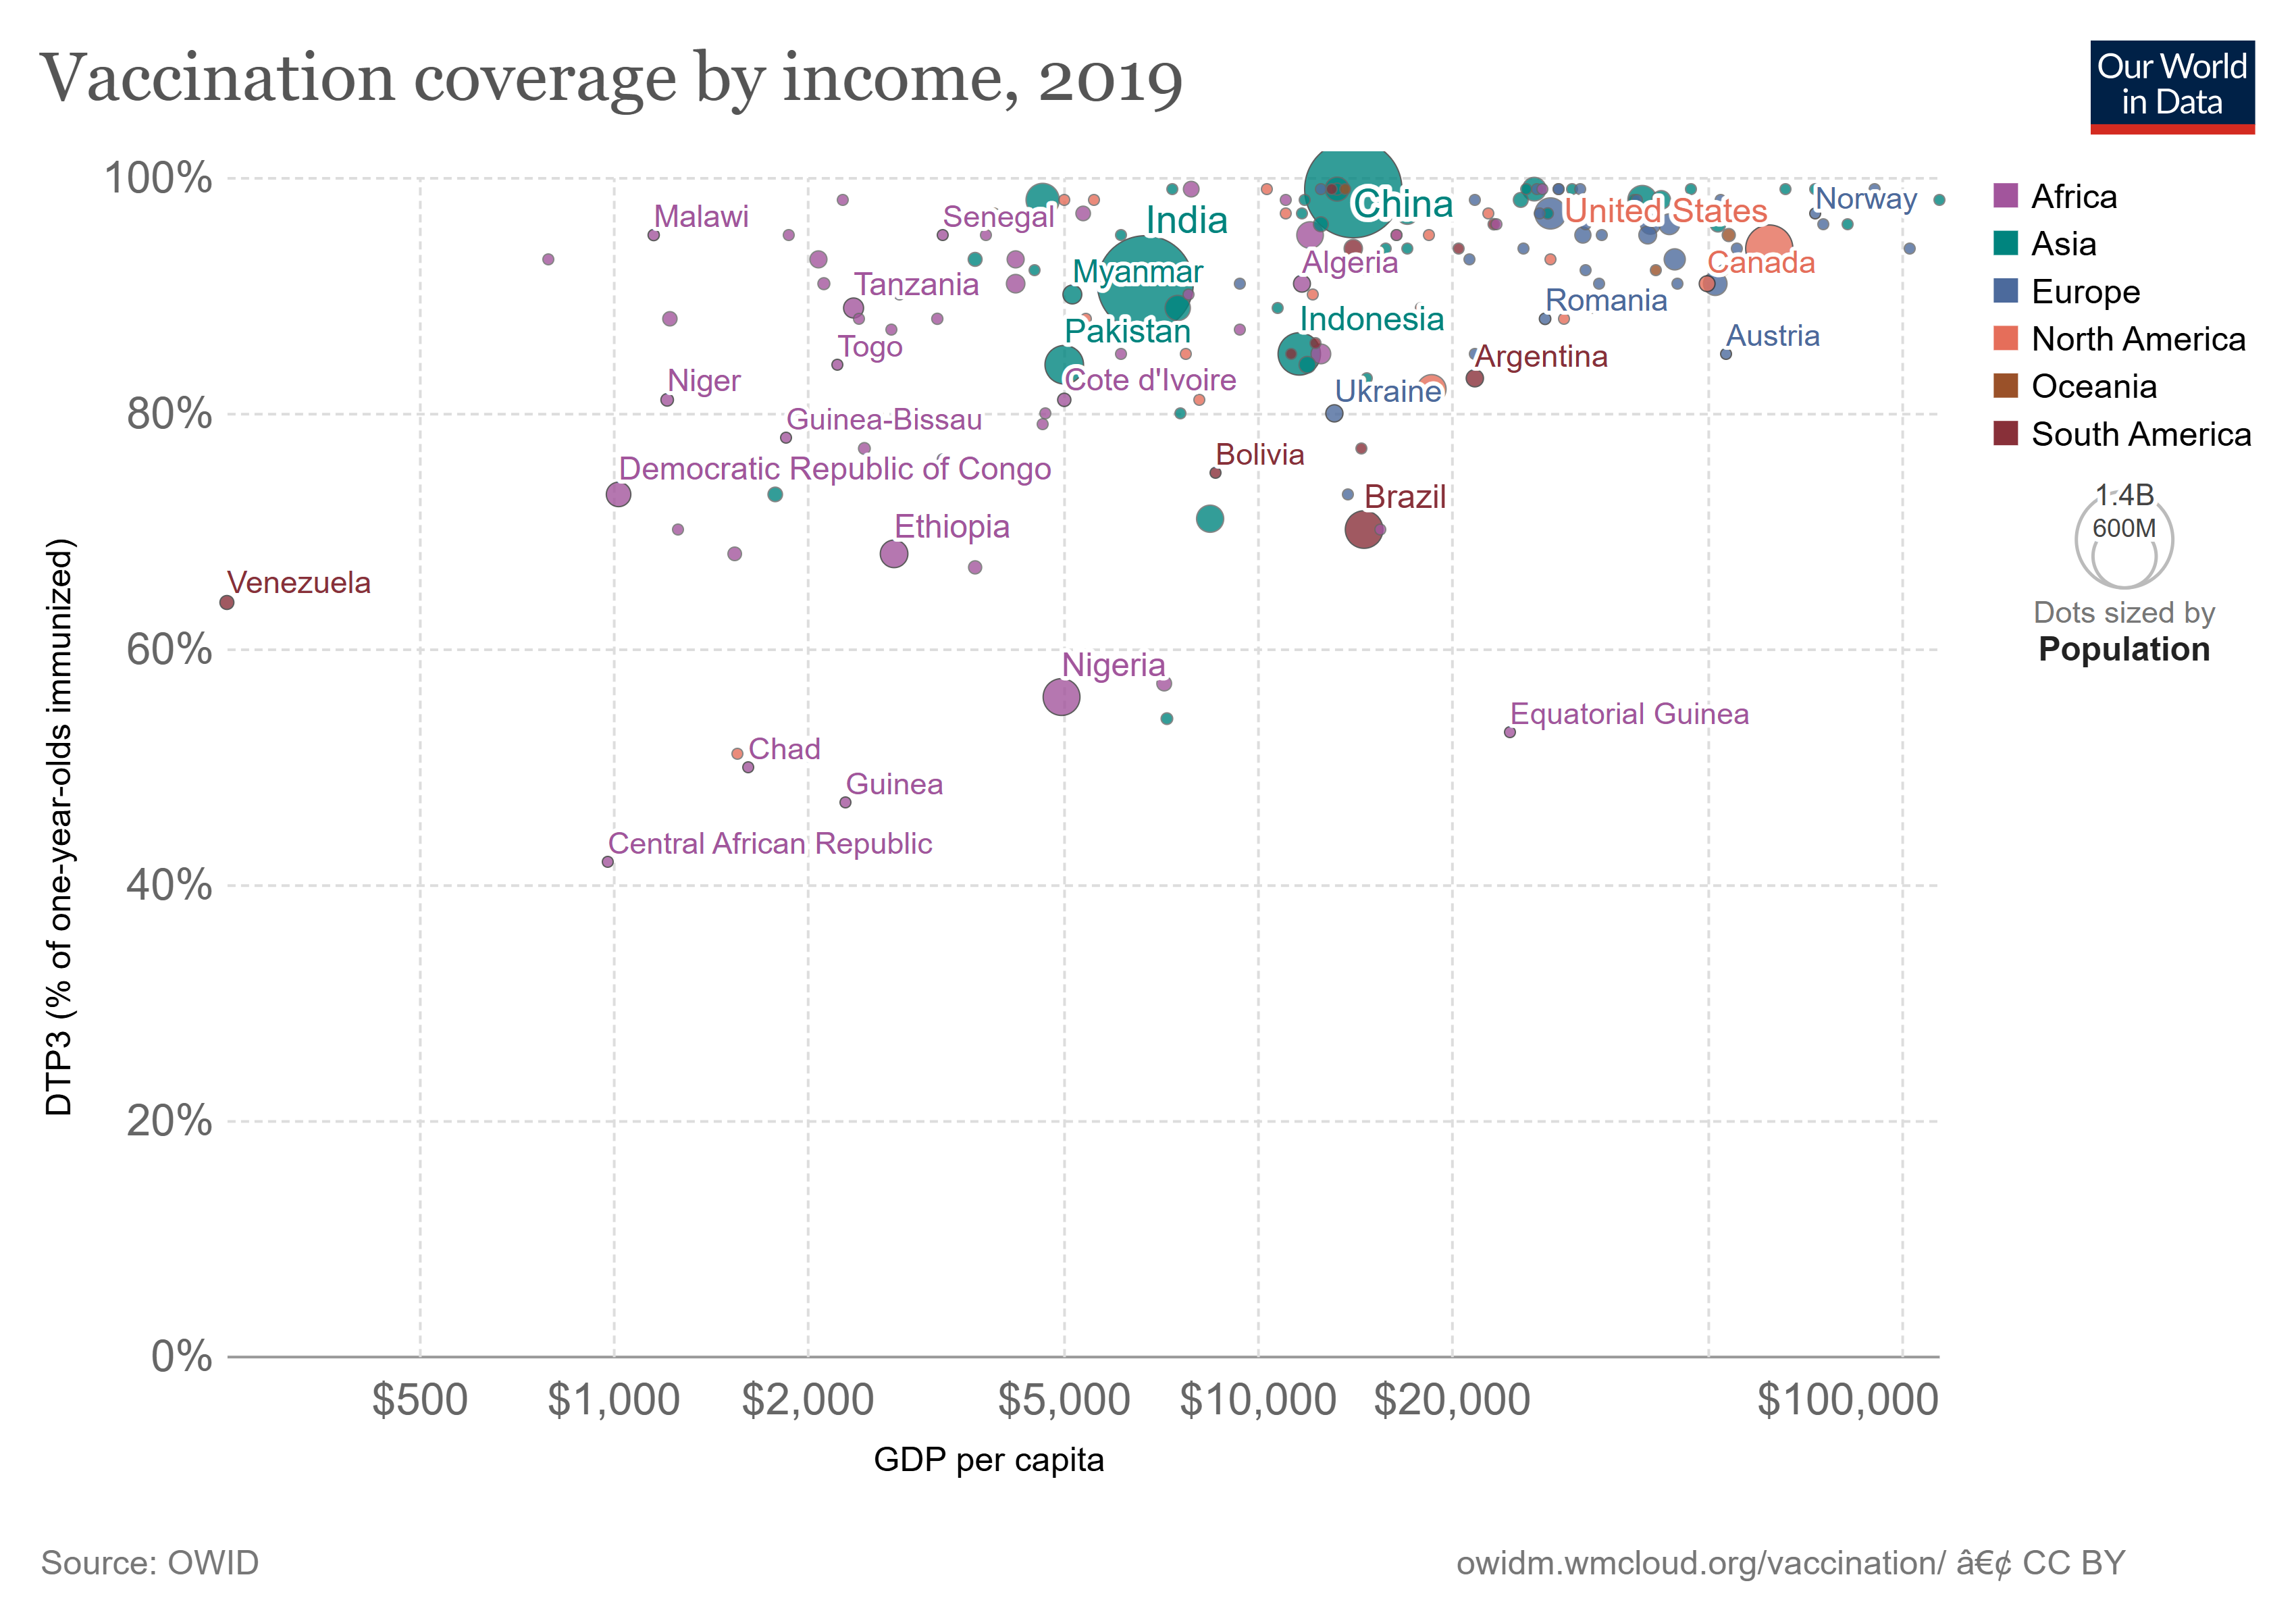
Vaccinationcoveragebyincome.png - Ozzie10aaaa

Measles-vaccine-coverage vs-measles-cases.png - Ozzie10aaaa

Figure 2. Across US sectors, value added scales with the number of employees.png - Artistosteles

Figure 3. Bichler and Nitzan’s spurious correlation.png - Artistosteles
A SHIFT FROM THE PROBLEMATIC OF “TRANSFORMATION”.png - Artistosteles
A SHIFT FROM THE PROBLEMATIC OF “TRANSFORMATION”Figure1.png - Artistosteles
A SHIFT FROM THE PROBLEMATIC OF “TRANSFORMATION”.Figure1.png - Artistosteles