Wikimedi'Òc
Modes d'emploi

Cet album fait partie des albums
Cet album photos contient les sous-albums suivants :


IncomeInequality.svg - DavidMCEddy

IncomeInequality8square.svg - DavidMCEddy

IncomeInequality7.svg - DavidMCEddy

IncomeInequality9b.svg - DavidMCEddy
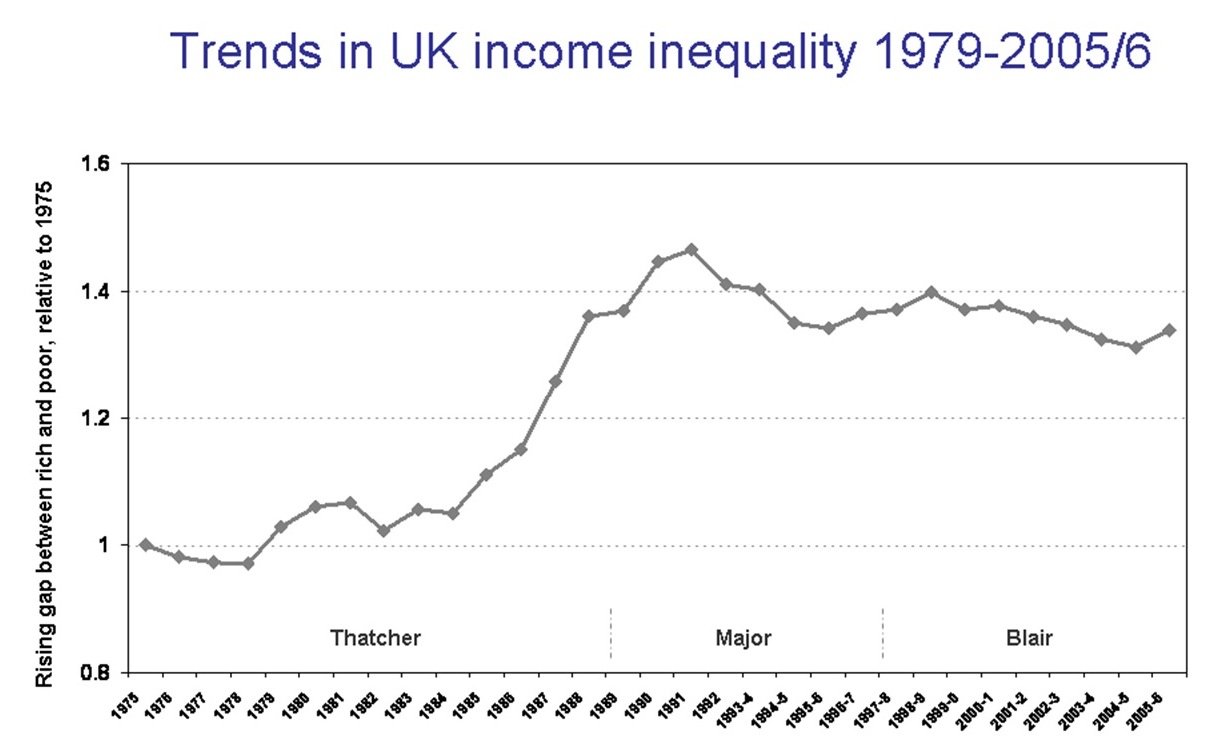
Trends in UK income inequality 1979-2005-6.jpg - Waddie96

Trends in US income inequality 1975-2005.jpg - Wodgester

Gini 2006-2012.jpg - Aldim

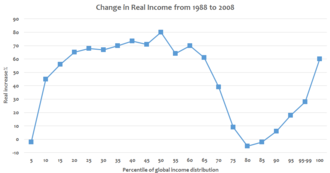
Global changes in real income by income percentile - v1.png - Farcaster

Distribution of Average Income Growth for 99 and 1 percent.svg - Delphi234

Distribution of Average Income Growth.svg - Jagulin

Wealth inequality panel - v1.png - Farcaster
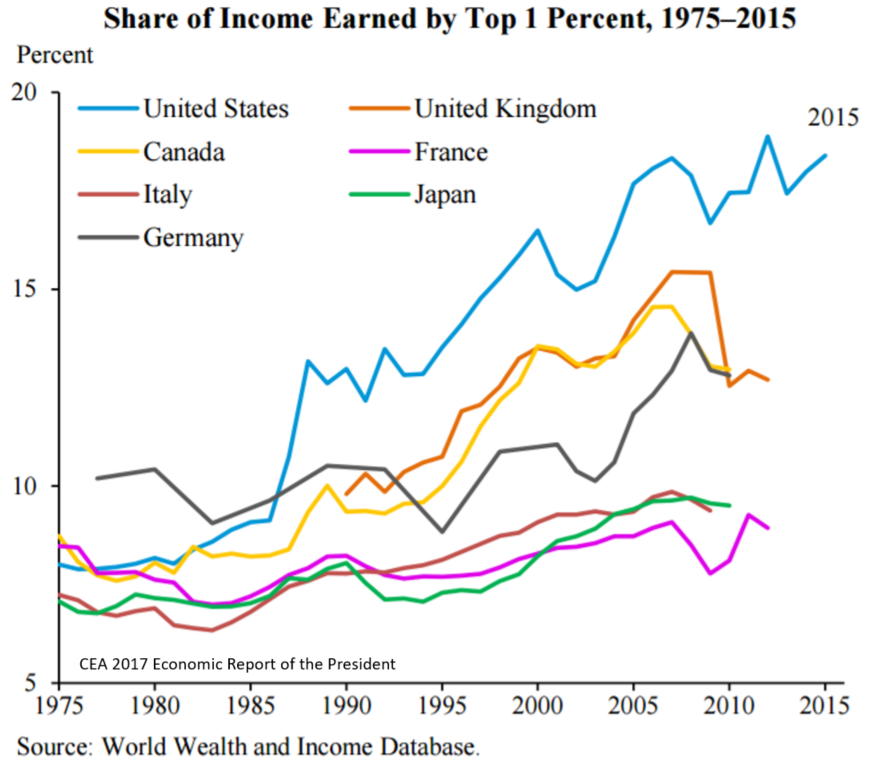
Income inequality - share of income earned by top 1% 1975 to 2015.png - Farcaster

Ameya Pawar wealth worship perpetuates income inequality 18813438 1438375246222371 2320159629191503491 n.jpg - SecretName101

Top income inequality in the United States.png - James 4

Kamala Harris- "These are women issues..." C6atoIqXQAAjSQl.jpg - SecretName101

Productivity Gap - v1.png - Farcaster
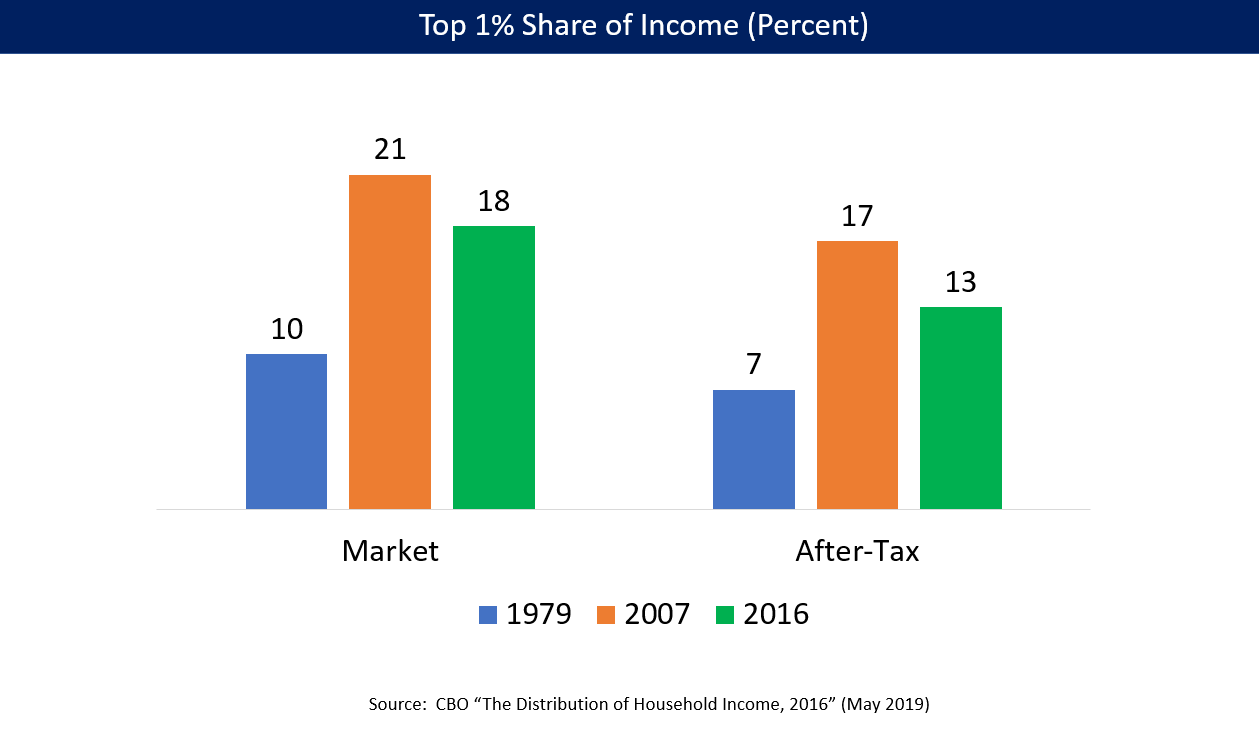
Top 1 pct share of income 1979 2007 2014.png - Farcaster
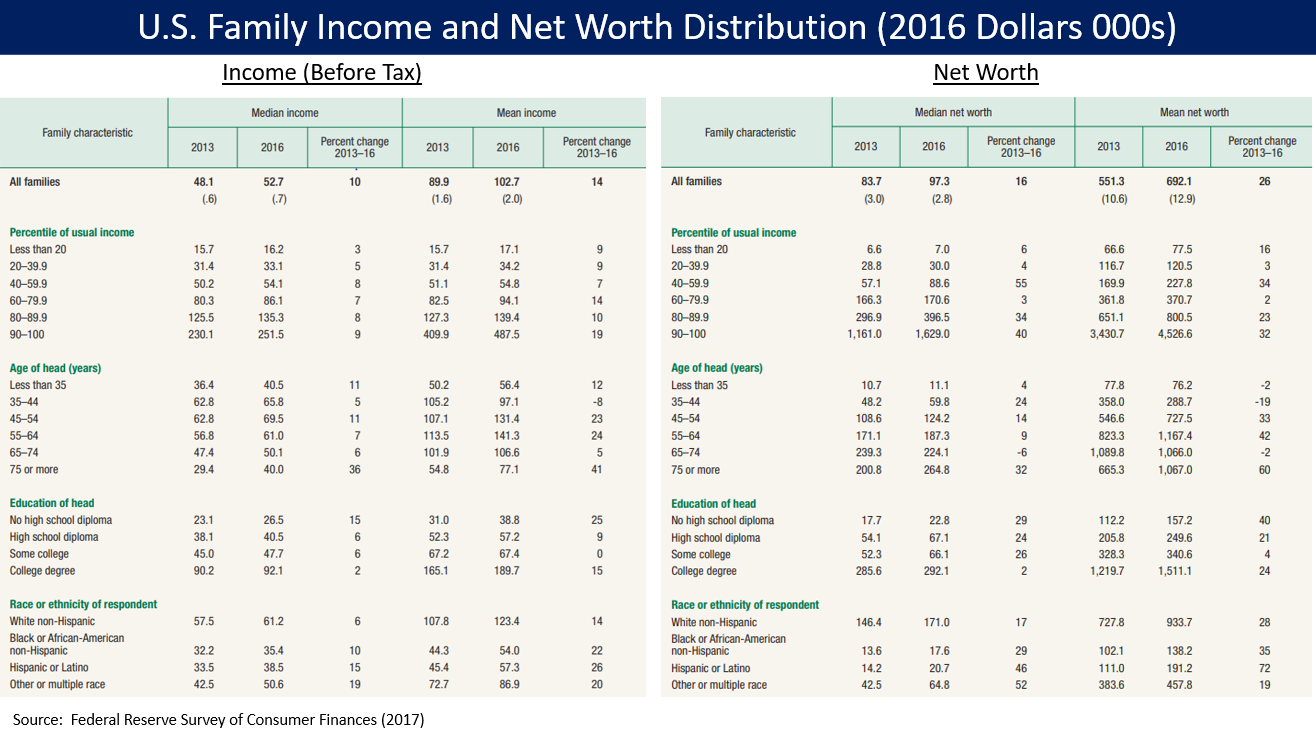
U.S. Income and Net Worth Distribution.png - Farcaster

U.S. Real Pay per Hour - Production & Non Supv Employees.png - Farcaster

U.S. inflation and compensation measures - v1.png - Farcaster
Douglas Rushkoff’s Advice for the Next President - -45should.webm - SecretName101

MTR-Share1.png - Mayakruha

CBO 1979 to 2015 - Cumulative Real Household Income Increase.png - Farcaster

Disposable income, by NUTS 2 regions, 2006 (1) (PPCS per inhabitant).png - Labelle 911

Development of Gini coefficients for EU member states.svg - Quarter to five

Development of the S80S20 quantile share ratio for EU member states.svg - Quarter to five

Income distribution in the United States.png - Wikideas1
Income distribution after taxes and transfers.jpg - Wikideas1

S80 S20 Ratio by Sex NL 1995-2017 EUSILC.svg - Theresa.lo93

S80 S20 Ratio by Sex IT 1995-2017 EUSILC.svg - Theresa.lo93

Risk of Poverty and Social Exclustion NUTS2 IT 2017 EUSILC.svg - Theresa.lo93

Anteil des oberen Dezils am nationalen Äquivalenzeinkommen - Dänemark.svg - Hkercz

Gini Koeffizient nach OECD-Bemessung in Dänemark.svg - Hkercz

S80-S20 Einkommensquintilverhältnis nach Geschlecht in Dänemark.svg - Hkercz

Verfügbares Haushaltseinkommen nach NUTS-2-Regionen Dänemark.svg - Hkercz

Armut und soziale Ausgrenzung Dänemark.svg - Hkercz

Anteil der Top 10 % am Gesamteinkommen in AT EU27, 2005-2017.svg - Christian141189

Anteil der Top 10 % am Gesamteinkommen in HU EU27, 2005-2017.svg - Christian141189

Takoma Park 4th 3695 (48208596822).jpg - SecretName101

Ruhsal bozukluk yaygınlığı-TR.jpg - Uralunlucayakli
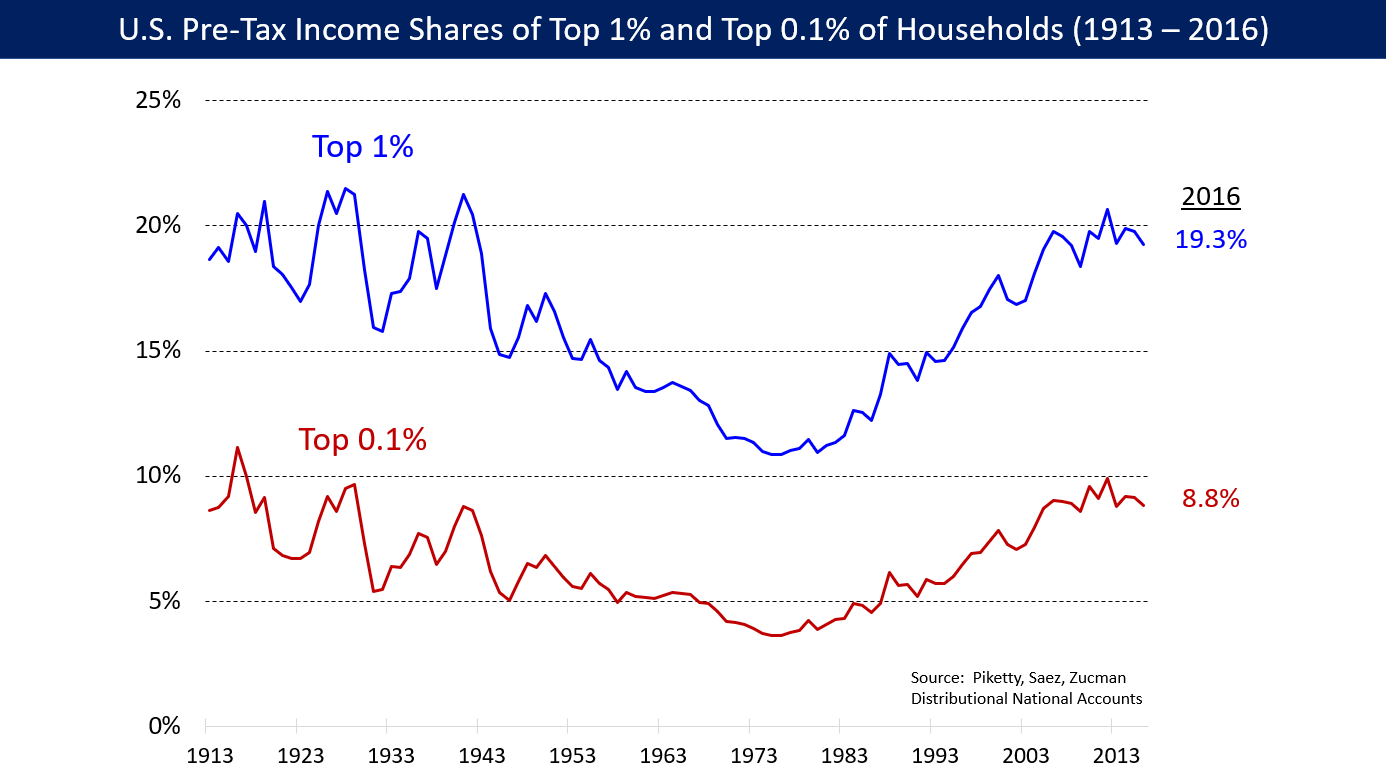
U.S. Pre-Tax Income Share Top 1 Pct and 0.1 Pct 1913 to 2016.png - Farcaster

U.S. Top 1% Income Shares, CBO and PSZ Data 1979-2016.png - Farcaster

1970- Relative income growth by percentiles - US.png - RCraig09

1970- Relative income growth by percentiles - US logarithmic.png - RCraig09

給与所得者の所得階層別構成比.png - Fnweirkmnwperojvnu

女性給与所得者の所得階層別構成比.png - Fnweirkmnwperojvnu

女性給与所得者の所得階層別人数.png - Fnweirkmnwperojvnu

COVID-19 Nov 2020 Eure Schwestern fordern fairen Lohn! (2).jpg - Stesso

Fairer-Lohn-Schwestern 1 2020-11-07.jpg - Stesso

COVID-19 Nov 2020 Eure Schwestern fordern fairen Lohn! (1).jpg - Stesso

Billionaire wealth.png - Pacha Tchernof
Inequality after taxes and transfers in Australia, Germany, UK and US 1990–2020.png - Buidhe
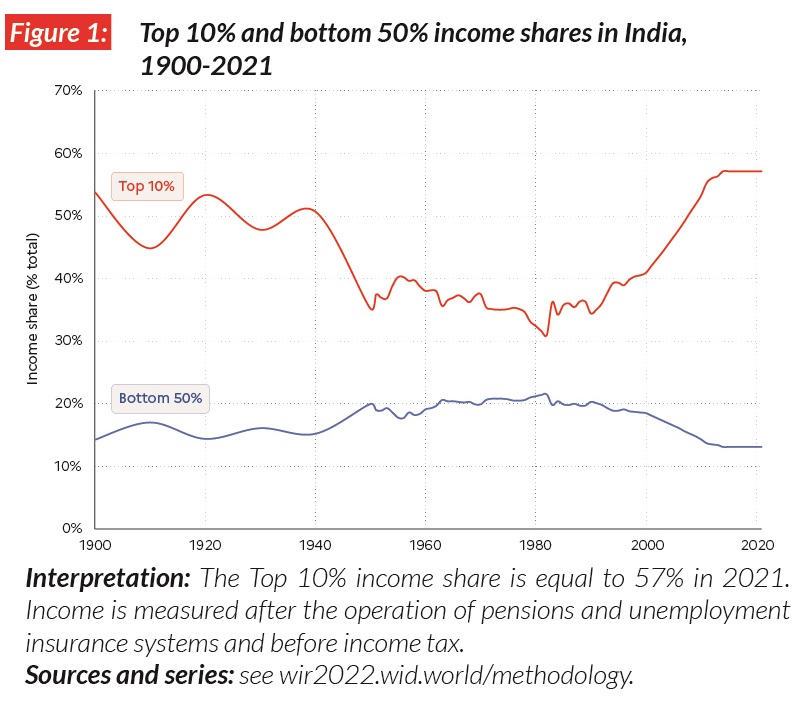
Top 10% and bottom 50% income shares in India 1900-2021.jpg - Elliptic2726

1907- Income inequality and union participation.svg - RCraig09

20230810 Ivy-Plus admission rates vs parent income percentile.svg - RCraig09

Hours Worked Compared to Earnings Per Week.webp - Wikideas1

Evolution des inégalités de revenu dans le monde de 1820 à 2020.png - Médicis

Income percentiles, with median and relative poverty levels marked.png - WhatamIdoing

1960- Tax rates of richest versus low income people - US.svg - RCraig09

Global map of high inequality countries, 2022.png - Florin Talasman

Global-inequality-in-1800-1975-and-2015.png - PJ Geest