Wikimedi'Òc
Modes d'emploi

Cet album fait partie des albums
Cet album photos contient les sous-albums suivants :


Imported Crude Oil as a Percent of US Consumption 1950-2003.jpg - Quasipalm

USEnFlow02-quads.gif - JdH

US electricity prod from coal 1995 2006.gif - Xenonice~commonswiki

US Energy Consumption by Source 2007.PNG - RockyMtnGuy

US Energy Consumption by Sector 2007.PNG - Adrignola

Annual US Natural Gas Imports 1973-2007.jpg - Kgrr
Electricity use kwh per customer 2000-05.PNG - File Upload Bot (Magnus Manske)

US historical energy consumption.PNG - File Upload Bot (Magnus Manske)
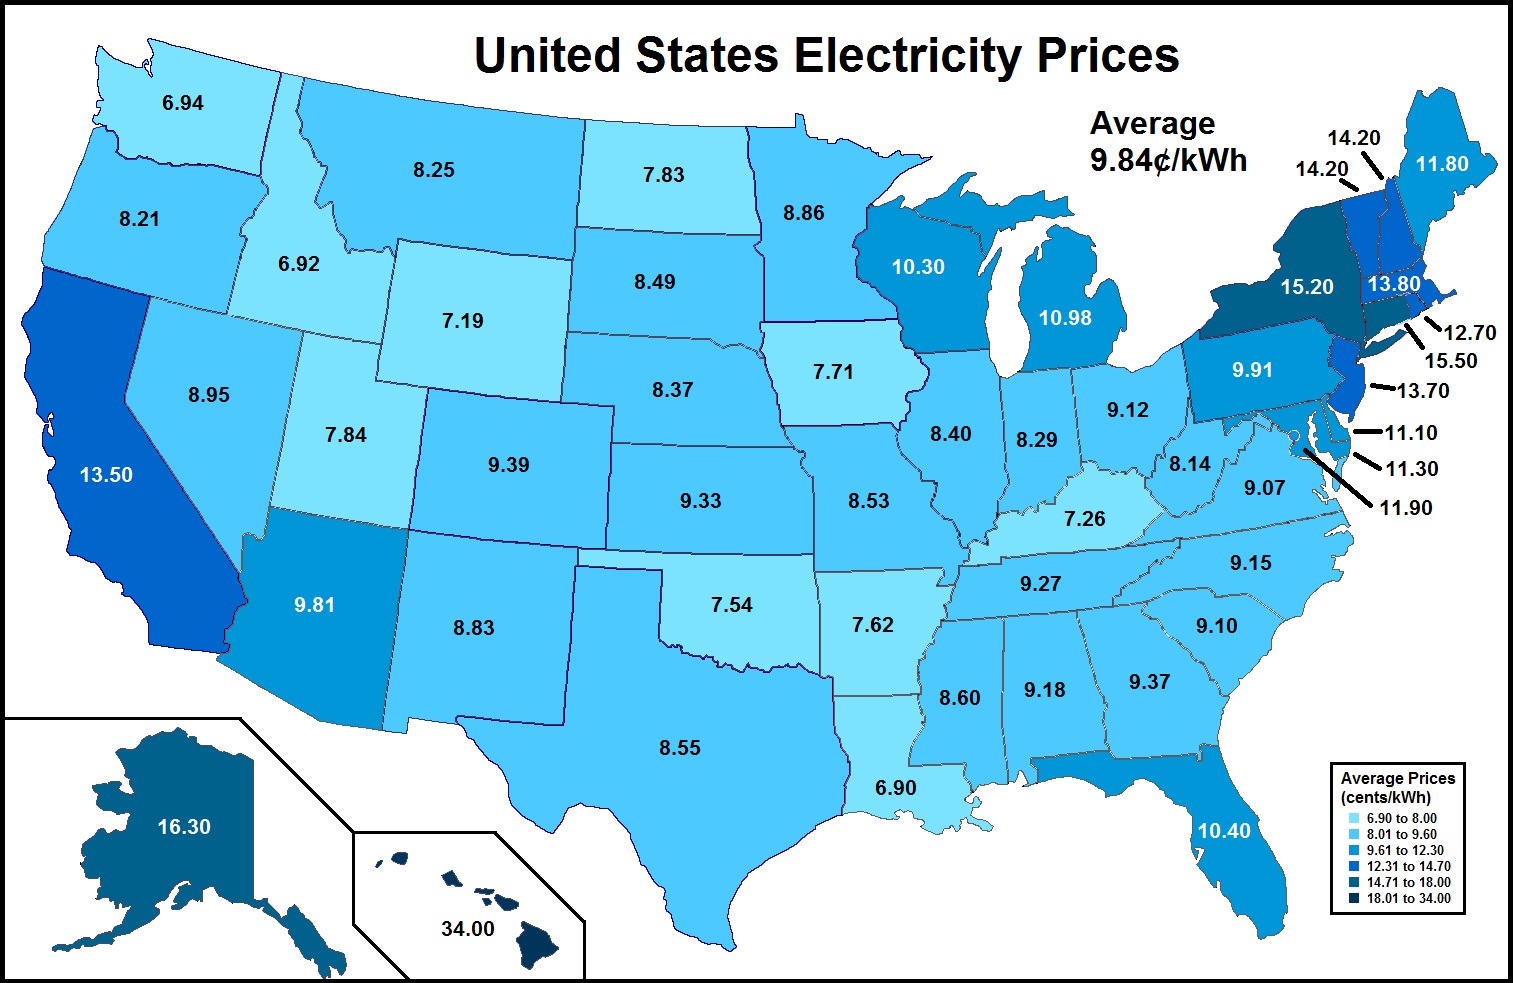
Average Retail Price of Electricity by State.jpg - Delphi234
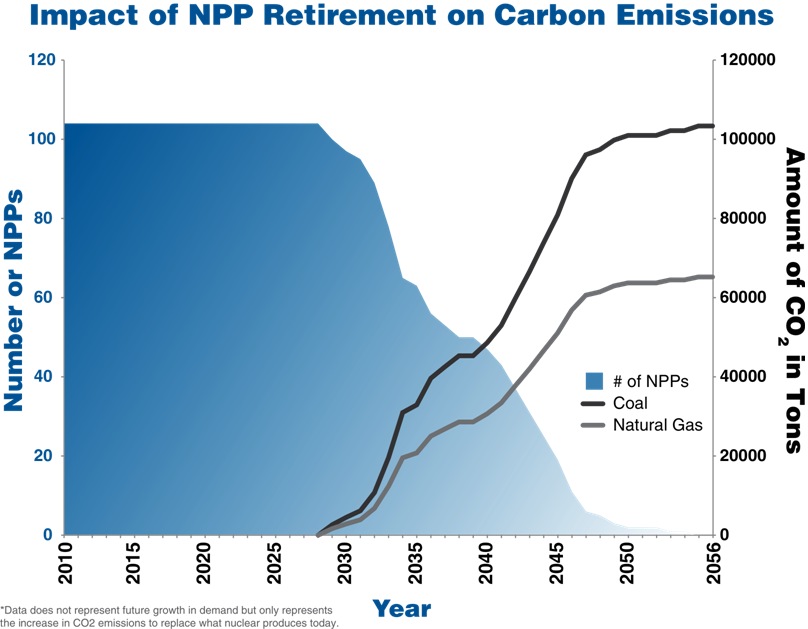
CO2&NPPs.png - Brett R. Stone

US gas production.jpg - File Upload Bot (Magnus Manske)

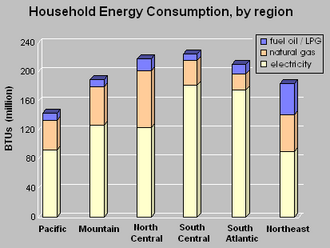
US household energy usage.png - File Upload Bot (Magnus Manske)

USEnergyFlow08-quads.png - Utoks

Gas Prices Short Term.png - File Upload Bot (Magnus Manske)
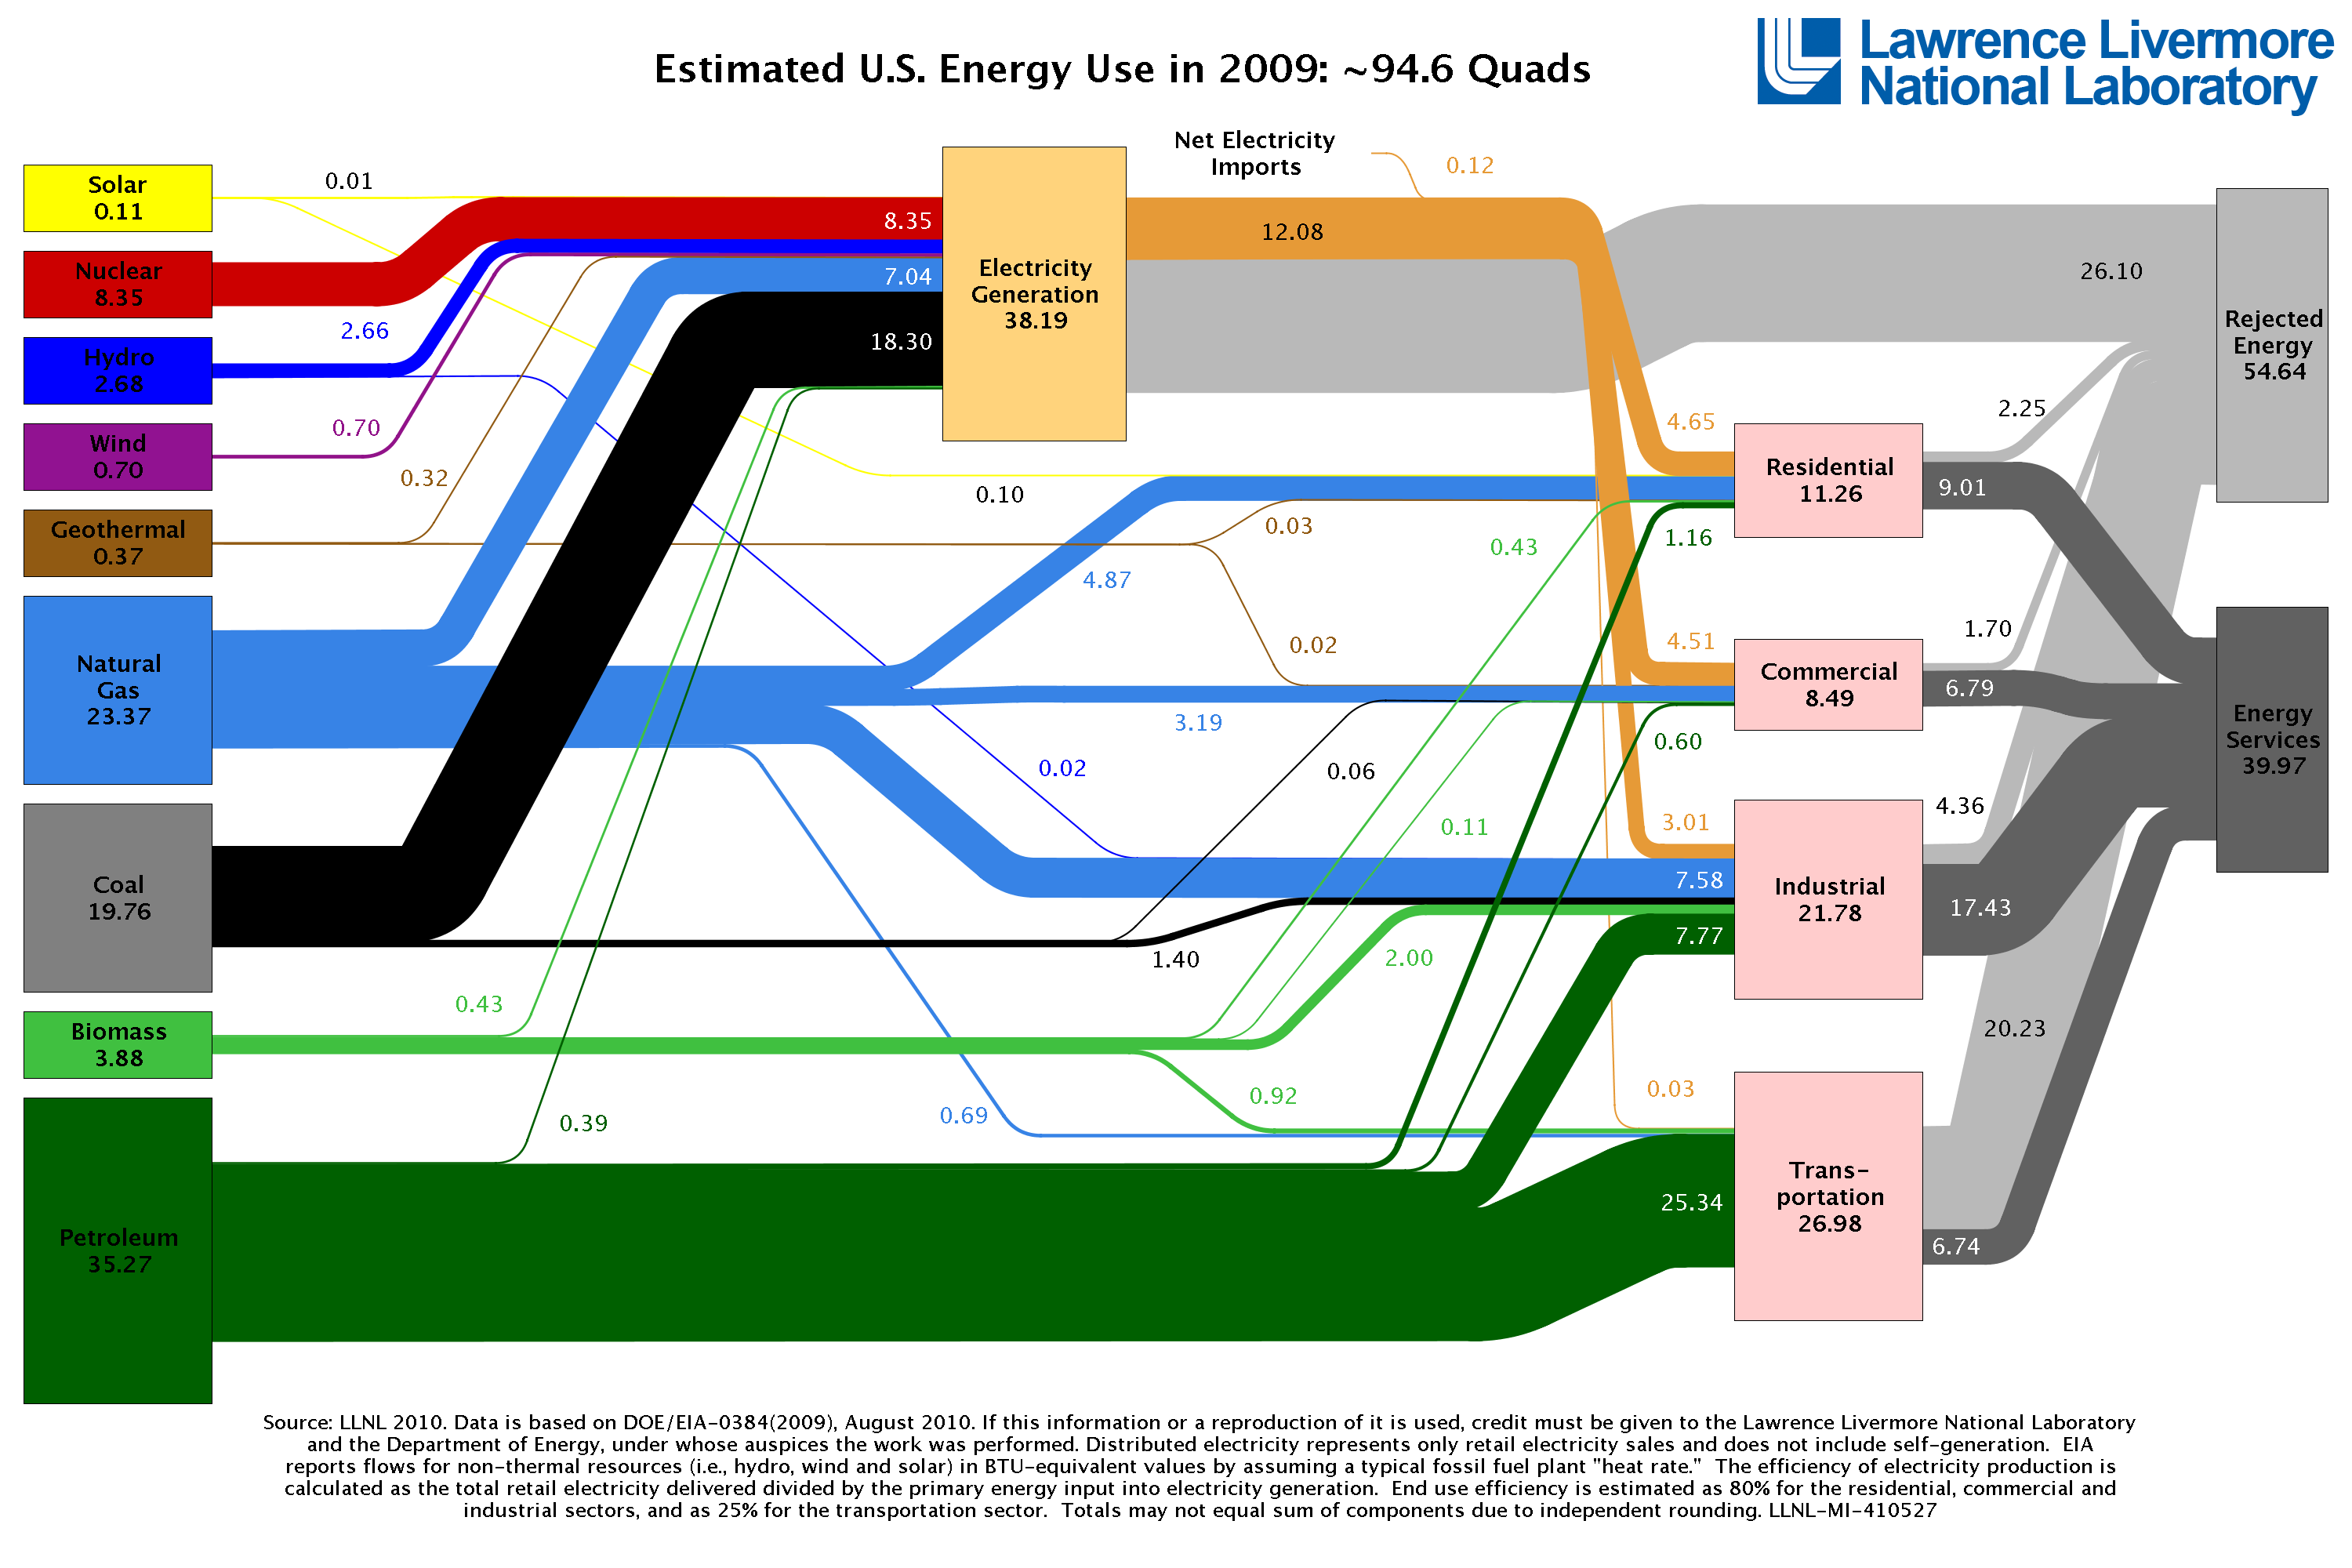
LLNL US Energy Flow 2009.png - Cubic Hour

Graph 2.x600y480.jpg - Hammonjw

EROI - Ratio of Energy Returned on Energy Invested - USA.svg - Mrfebruary

Residential-Energy-consumption.png - Allspamme~commonswiki

LLNLUSEnergy2010.png - Limulus

US Electric Energy Consumption by Consumer Communities.gif - Queenwe
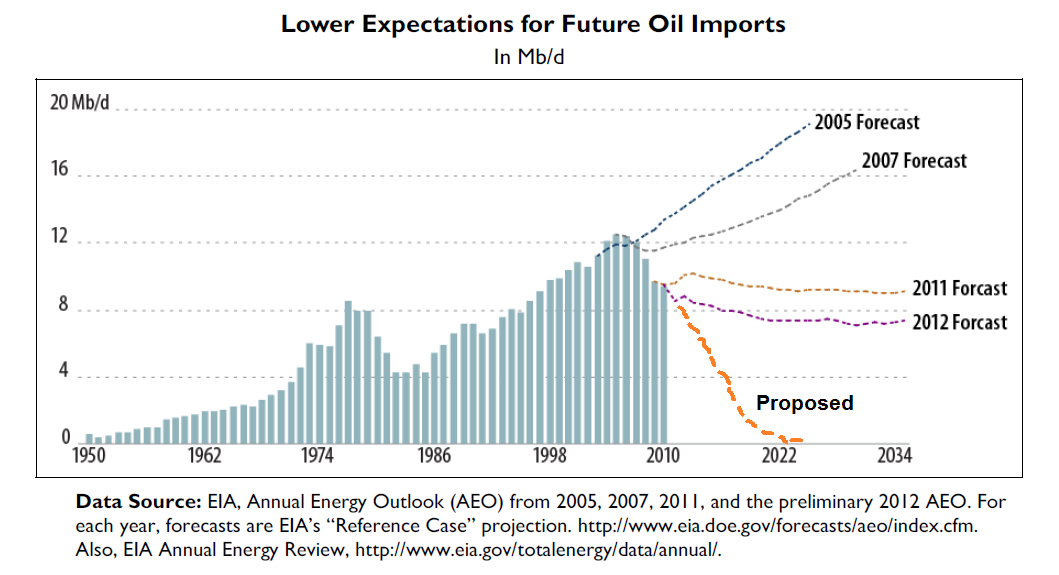
Future Oil Imports.png - Delphi234
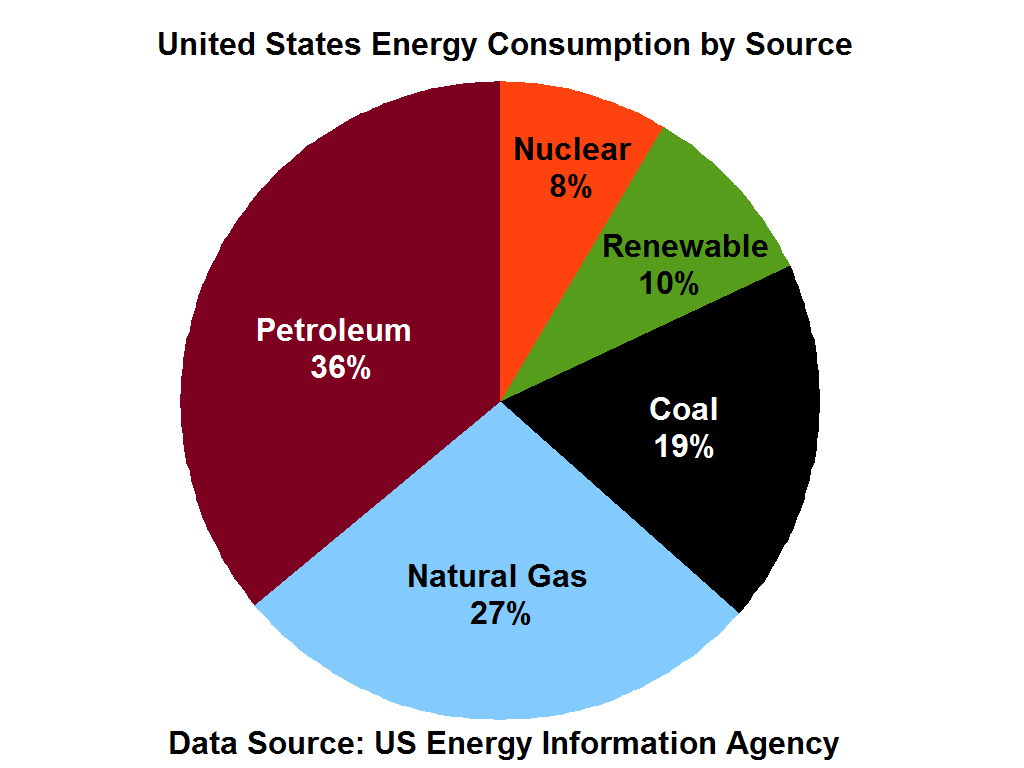
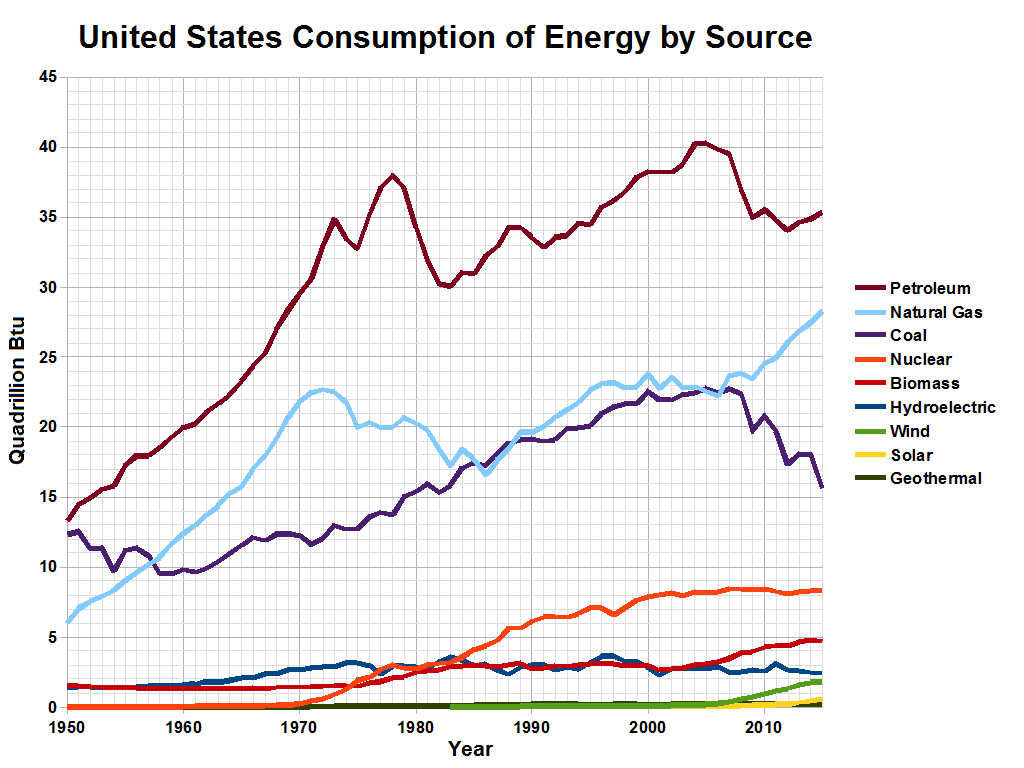
US Energy Consumption by Source.png - Delphi234
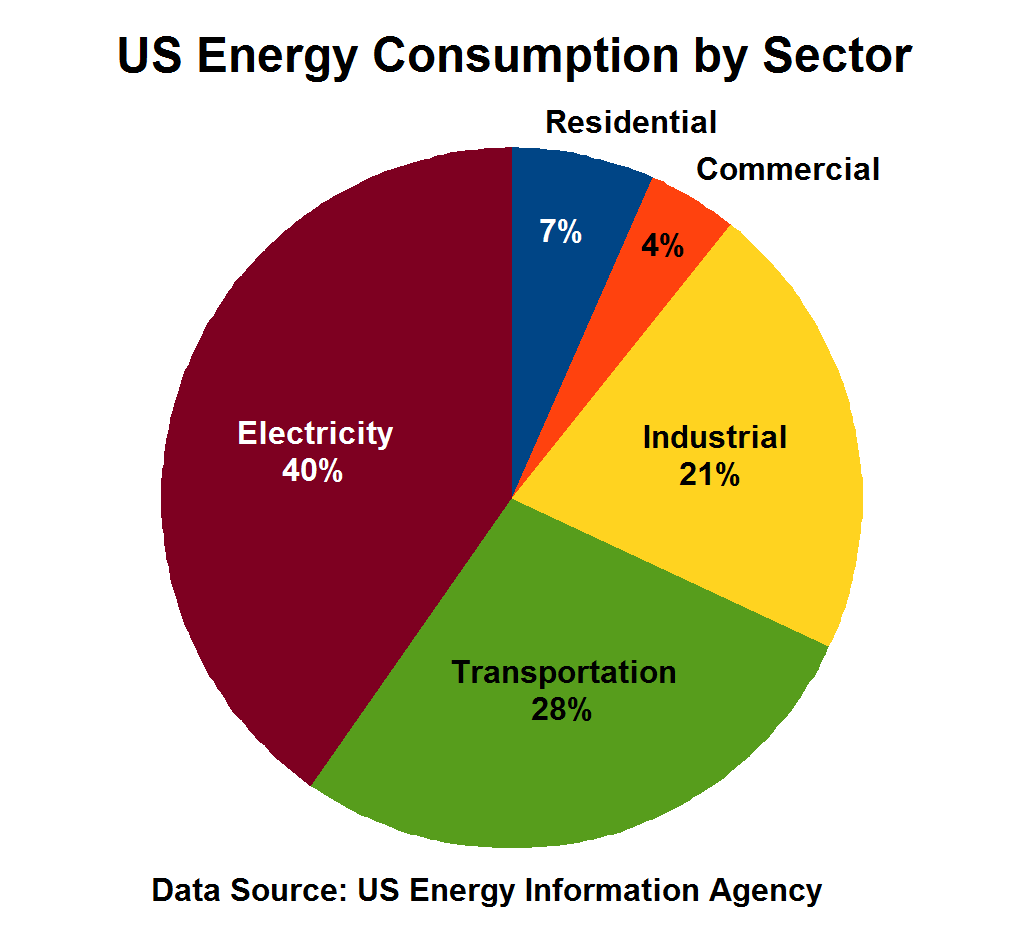
US Energy Consumption by Sector.png - Delphi234
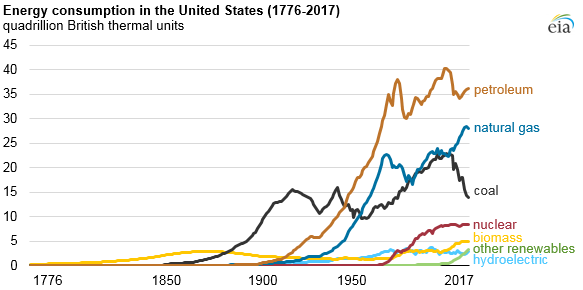
US historical energy consumption.png - Besselfunctions

US energy consumption by source semilog.png - Delphi234

US energy consumption by source 1800-2010 semilog.png - Delphi234

US Energy Flow-1970.png - Delphi234

US Energy Flow-1960.png - Delphi234

US Energy Flow-1950.png - Delphi234
US Energy Flow-1990 (1973 projection).png - Delphi234

US Energy Flow-1980 (1973 projection).png - Delphi234
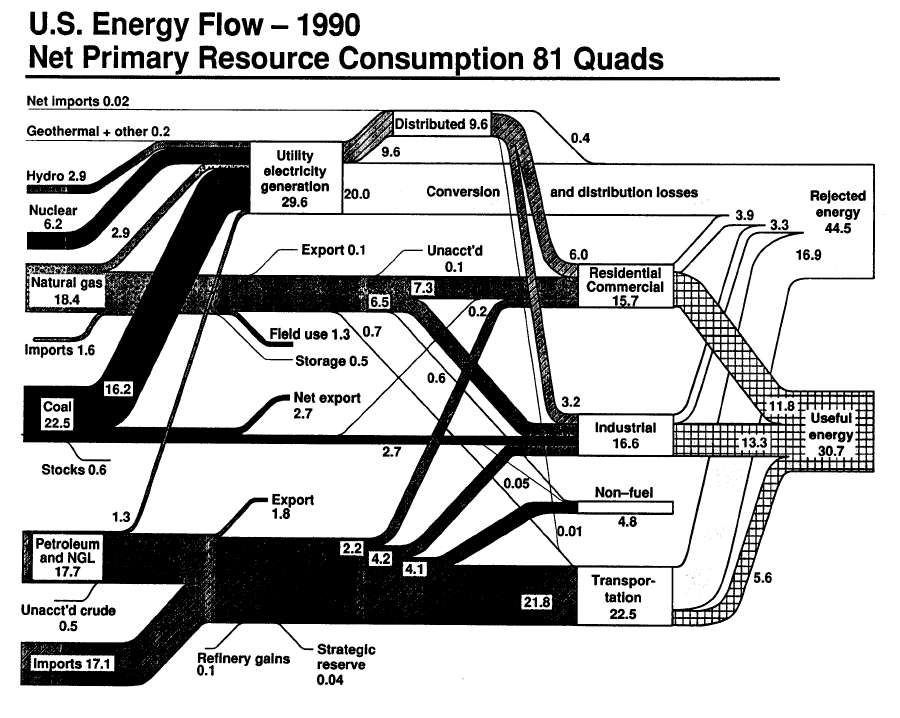
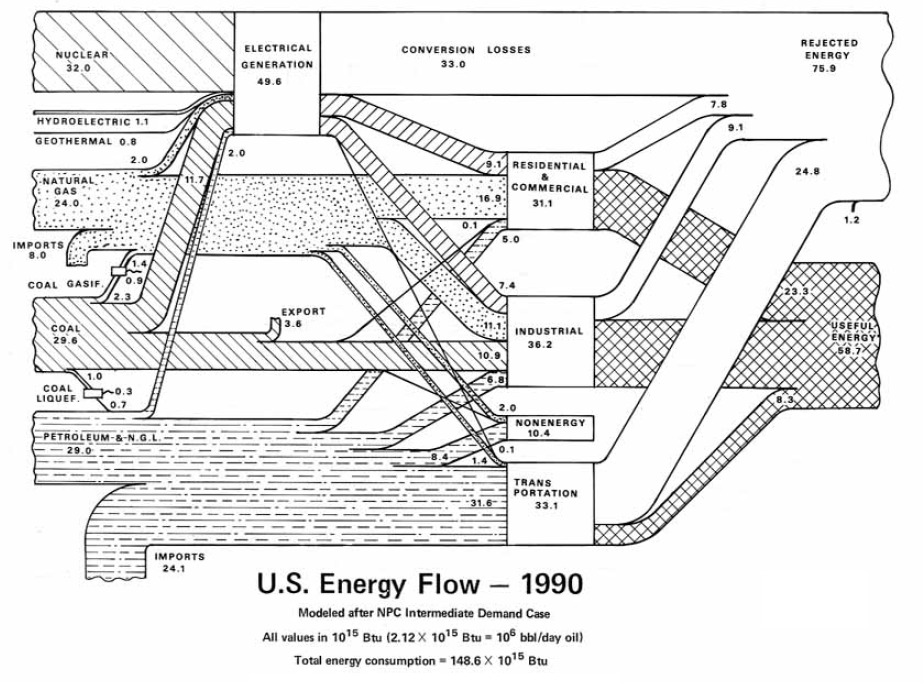
US Energy Flow-1990.png - Delphi234
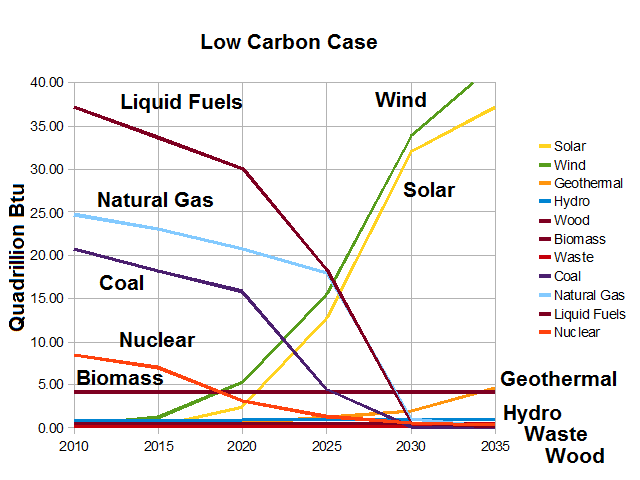
US energy consumption 2035-Low Carbon Case.png - Delphi234

US energy consumption 2035-EIA Reference Case.png - Delphi234

US energy consumption 2035-Reference Case.png - Delphi234

US energy consumption 2010-2050.png - Delphi234

US Energy Flow-2020.png - Delphi234

US Energy Flow-2030.png - Delphi234

US Energy Flow-2010.png - Delphi234

US Energy Flow-2050.png - Delphi234

US Energy Flow-2040.png - Delphi234

US Energy Flow 2010.png - Delphi234

US Energy Consumption by Source 1635-2006.png - Delphi234
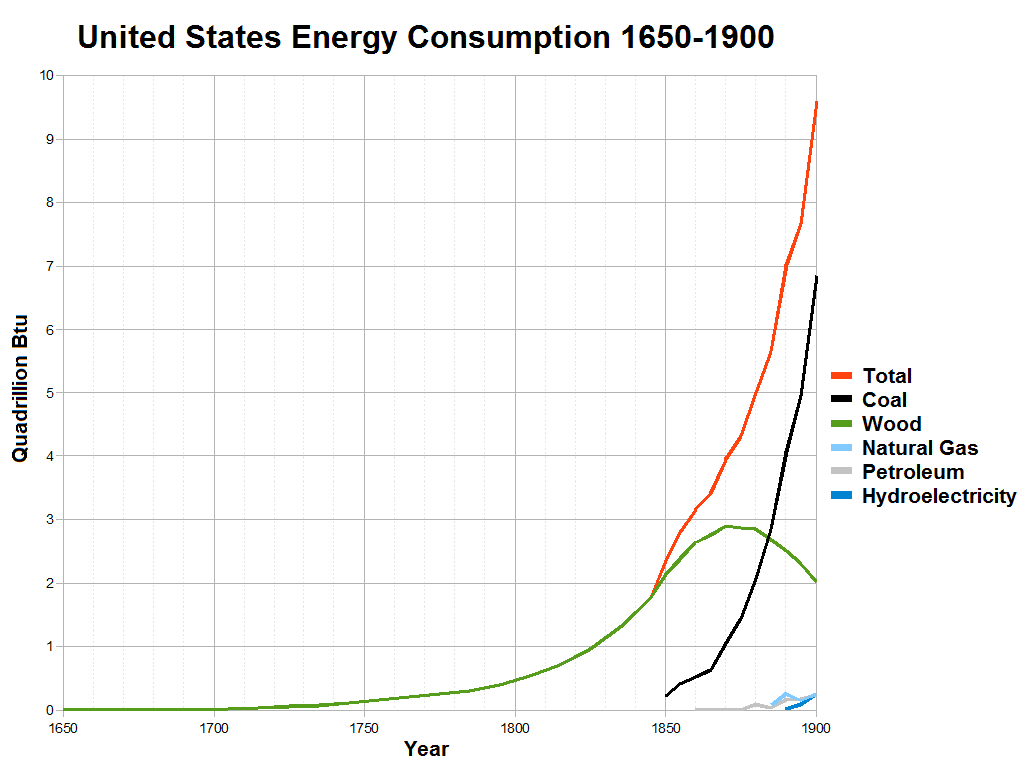
US energy consumption 1650-1900.png - Delphi234

US energy consumption 1650-1900 semilog.png - Delphi234

United States per capita energy use 1650-2010.png - Delphi234
US energy consumption.png - Delphi234

LLNLUSEnergy2011.png - Limulus

US energy consumption by source 2011.png - Delphi234

United States Energy Consumption by Source 2000-2011.png - Delphi234

United States electricity generation by fuel 1990-2040.png - Delphi234

US Total Energy 1949-2011.png - Plazak
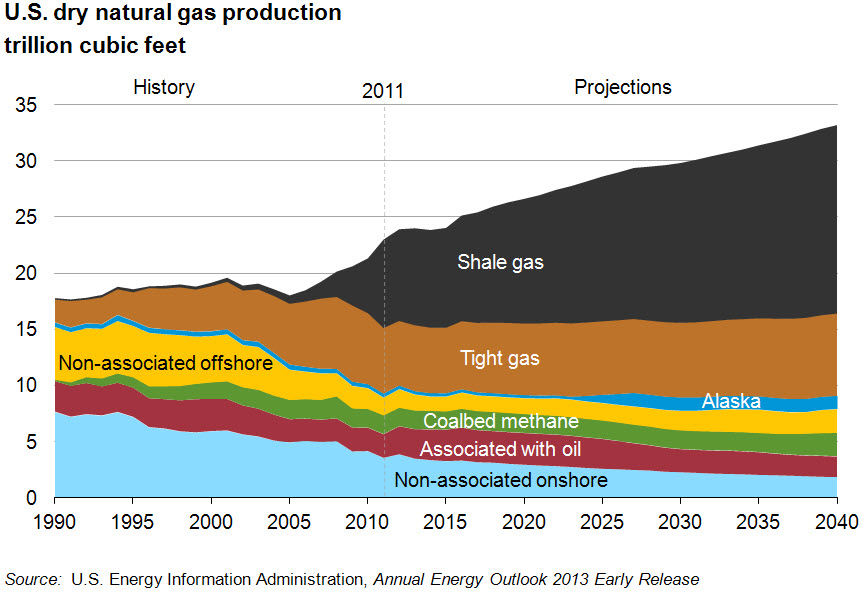
US Natural Gas Production 1990-2040.jpg - Plazak

Estimated Effect of Carbon Tax in US.png - Plazak

Utilis énergie habitant États-Unis.jpg - Jpjanuel
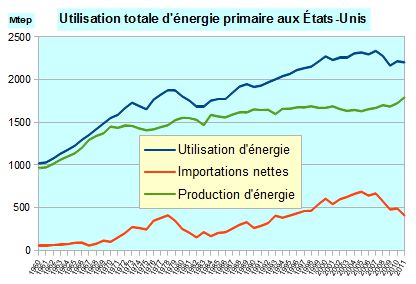
Utilis tot énergie primaire États-Unis.jpg - Jpjanuel

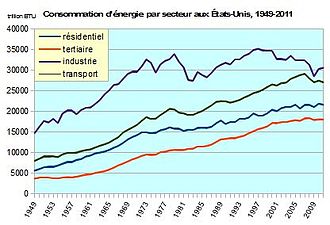
Conso énergie secteur États-Unis.jpg - Jpjanuel

US Percent of Energy Exported-Projected-2050.png - Delphi234

LLNLUSEnergy2012.png - Limulus

US energy consumption by source 2012.png - Delphi234

Figure 1 Life-Cycle of US Petroleum Imports.jpg - Sewall30

Figure 4 Petroleum Domestic Production, Imports and Consumption.jpg - Sewall30

Figure 7 Predicted Life-Cycle of Petroleum.jpg - Sewall30

Texas Electricity Generation.png - Delphi234

Texas Electricity Percentage.png - Delphi234

California Electricity Percentage.png - Delphi234

California Electricity Source.png - Delphi234

US Net Gas Imports.png - Plazak

US Uranium Imports 2012.png - Plazak

Tenyearhydrofacts.gif - Queenwe
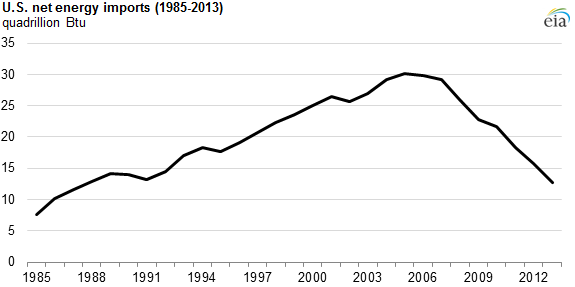
US Net Energy Imports.png - Plazak
Nuclear Free and Carbon Free United States Electricity Generation by 2028.png - Delphi234

U.S. 2013 Electricity Generation By Type crop.png - Daniel.Cardenas

US energy flow 2013.png - Delphi234
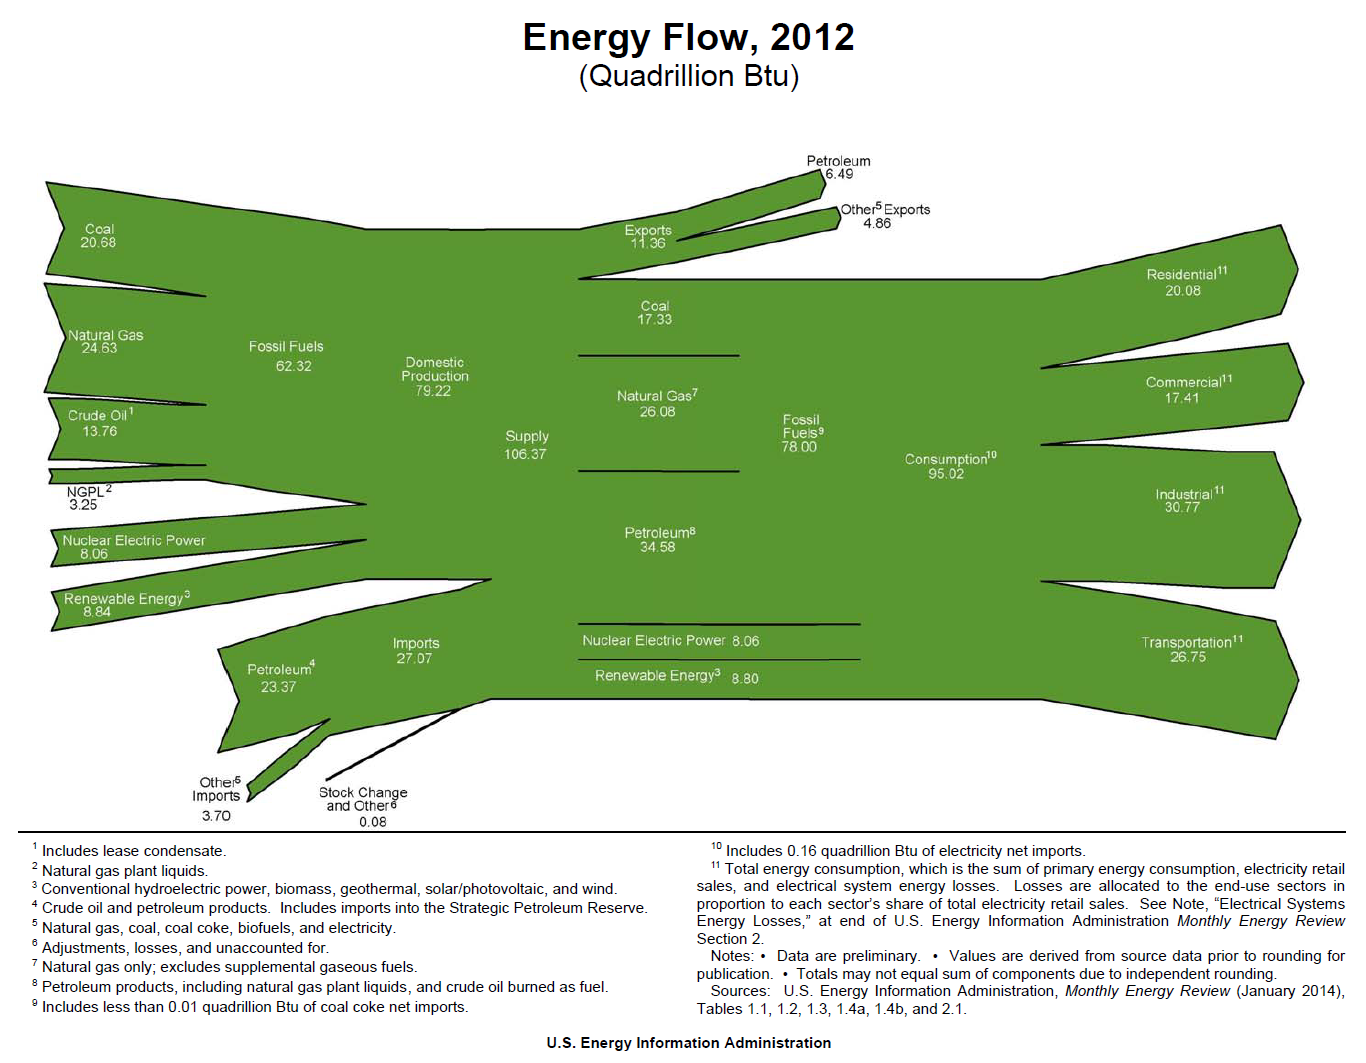
US energy flow 2012.png - Delphi234
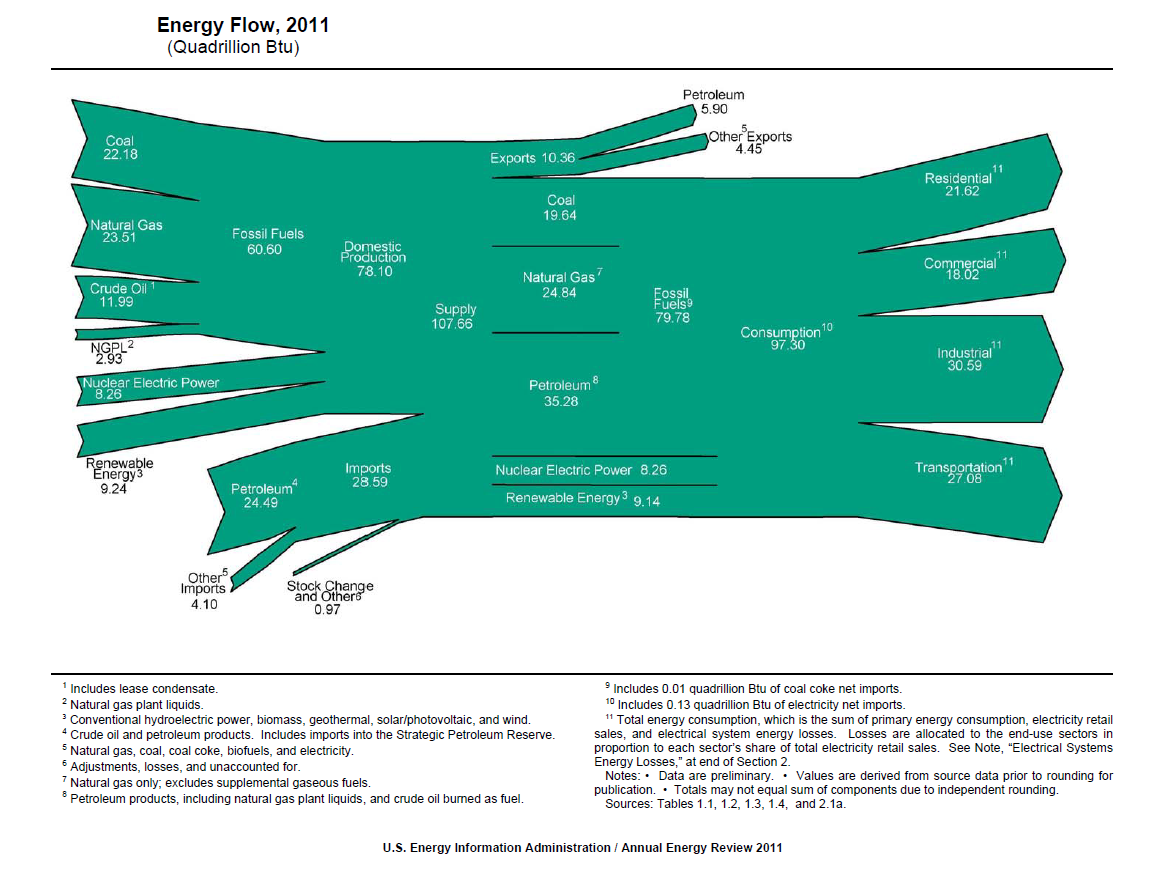
US energy flow 2011.png - Delphi234

US energy flow 2009.png - Delphi234

US Energy Consumption by Source 2013.png - Delphi234

History of energy consumption in the United States.svg - Delphi234

2011staterenewableelectricalgeneration.png - GifTagger

Average Residential Price of Electricity by State.svg - Delphi234

Average US Residential Price of Electricity by State fr.svg - Delphi234

Average US Residential Price of Electricity by State-2012.svg - Delphi234

US energy consumption by sector.svg - Delphi234

US Primary Energy Consumption by Source and Sector 2013.png - Delphi234

LLNLUSEnergy2013.png - Delphi234

US primary energy consumption by source.svg - Delphi234

US Average Cost of Delivered Fossil Fuel.svg - Kopiersperre

United States Energy Consumption by Source 2000-2013.png - Delphi234

US electricity generation by source.svg - Delphi234

Electric Energy Consumption by User Community.jpg - Queenwe
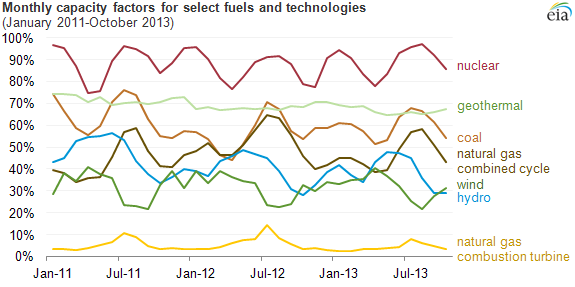
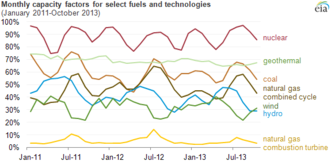
US EIA monthly capacity factors 2011-2013.png - Stang

2004-2014 Electric Energy ( B kWh) by Fuel Source.png - Ras67

Residential Average Cost per kWh 2004-2014.png - Ras67

Profile 2004-2014 of Residential Average Cost per kWh.png - Queenwe

2004-2014 Profile of Electric Energy by Fuel Source.png - Queenwe

10 yr Profile of Consumption by Category.png - Queenwe

2014 Electric Generation by State and by Fuel Source.png - Queenwe

USA 2014 Electric Energy Export or Import by State.png - Queenwe

Retail Customers.png - Queenwe

Expected Energy Output 2015-2019.png - Queenwe

Expected Energy Generation 2014-2019.png - Queenwe
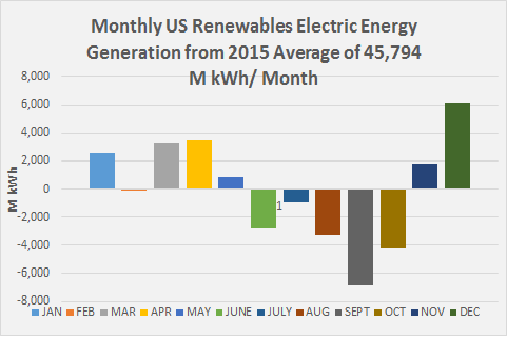
Monthly Profile US Renewables 2015.png - Queenwe

Monthly US Coal Profile 2015.png - Queenwe
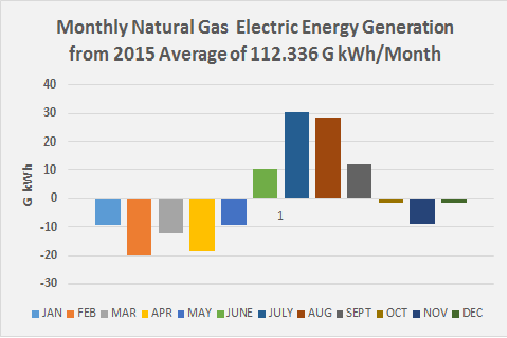
Monthly US Natural Gas Profile 2015.png - Queenwe
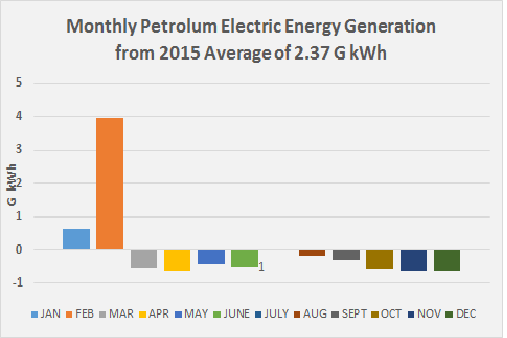
Monthly US Petrolum Profile 2015.png - Queenwe
Monthly US Nuclear Profile 2015.png - Queenwe

Profile of Electric Consumption 2014.png - Queenwe
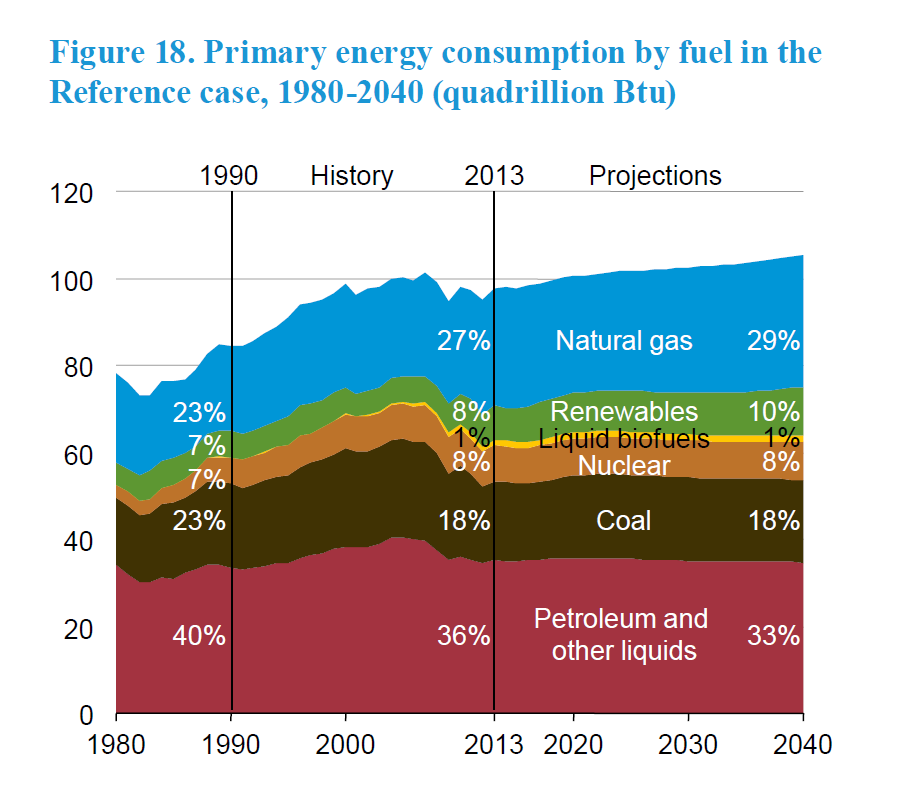
United States primary energy consumption 1980-2040.png - Delphi234

United States electricity generation by fuel 2000-2040.png - Delphi234

US renewable electricity generation AEO Reference case 2000-2040.png - Delphi234

US energy flow 2015.png - Delphi234

US energy flow 2014.png - Delphi234

Energy US 2014.png - Delphi234

Energy US 2015.png - Delphi234

Oil Balance US.svg - Raminagrobis

Gas Balance US.svg - Raminagrobis

Coal Balance US.svg - Raminagrobis

U.S. Electricity Production 2015.svg - Douglaspperkins

US oil imports by country.jpeg - FastilyClone

U.S. Net Electricity Generation 2001.svg - Zenhaus

US Electricity Source 2016.svg - Zenhaus

US Total Primary Energy Consumption in 2015.svg - Shahzad

U.S. Domestic Oil Production (6961921691).jpg - SecretName101
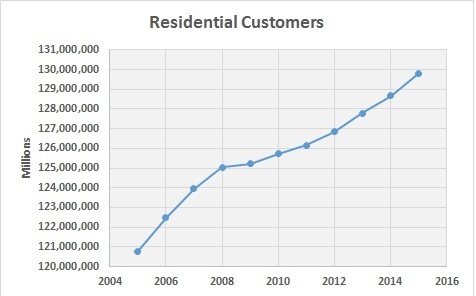
2015 Residential Customers.jpg - Queenwe

2015 Electric Generation by State by Fuel Source by % of State Generation.jpg - Queenwe

STATES in 2015 who EXPORTED Electric Energy.jpg - Queenwe

States in 2015 who had to IMPORT Eectric Energy.jpg - Queenwe

Energy Flow US 2016.png - Dbsseven

Energy Flow US 2017.png - Ruslik0

Annual electric distribution system costs for major U.S. utilties in billion 2017 dollars, 1997 through 2017 (43526937421).png - MarginalCost

Haynesville region natural gas production (January 2010-July 2018) (44530715841).png - MarginalCost
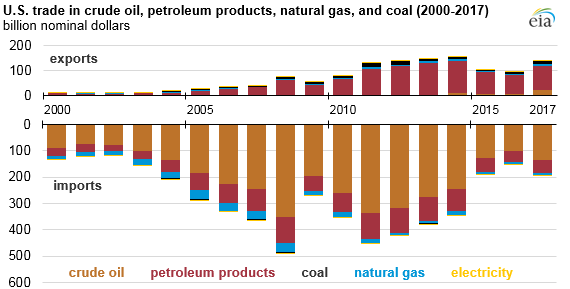
U.S. trade in crude oil, petroleum products, natural gas, and coal (2000-2017) (44637262144).png - MarginalCost

PJM electric generator capacity, capacity factors, and electricitiy generation for coal and natural gas-fired power plants (2013-2017) (31508572458).png - MarginalCost

PJM Interconnection coal and natural gas generating capacity changes (2013-2017) (43566833470).png - MarginalCost

PJM electric generator capacity, capacity factors, and electricitiy generation for coal and natural gas-fired power plants (2013-2017) (45333189252).png - MarginalCost

U.S. electric power carbon dioxide emissions (2000-2017) (43797645490).png - MarginalCost

Monthly U.S. field production of crude oil (January 1920-August 2018) (45664259591).png - MarginalCost

U.S. crude oil production in selected states and areas (January 1970-August 2018) (31791566138).png - MarginalCost

US Net Gas Imports.svg - Ergzay

U.S. annual coal production, 2008-2018, and weekly steam coal spot prices in 2018 (46819606022).png - MarginalCost

U.S. annual coal production, 2008-2018 (46819606022) (cropped).png - MarginalCost

2017 Electric Energy Consumption Profile.jpg - Queenwe

Value of selected energy trade between Canada and the United States, 2008 through 2018 (47950484413).png - MarginalCost

U.S. exports of liquefied natural gas (LNG) in January 2017 through May 2019 (48403827021).png - MarginalCost
Timing of state subsidies for nuclear power (48858457468).png - MarginalCost

Lower 48 U.S. states production of crude oil by API gravity in January 2015 through July 2019 (48880018261).png - MarginalCost
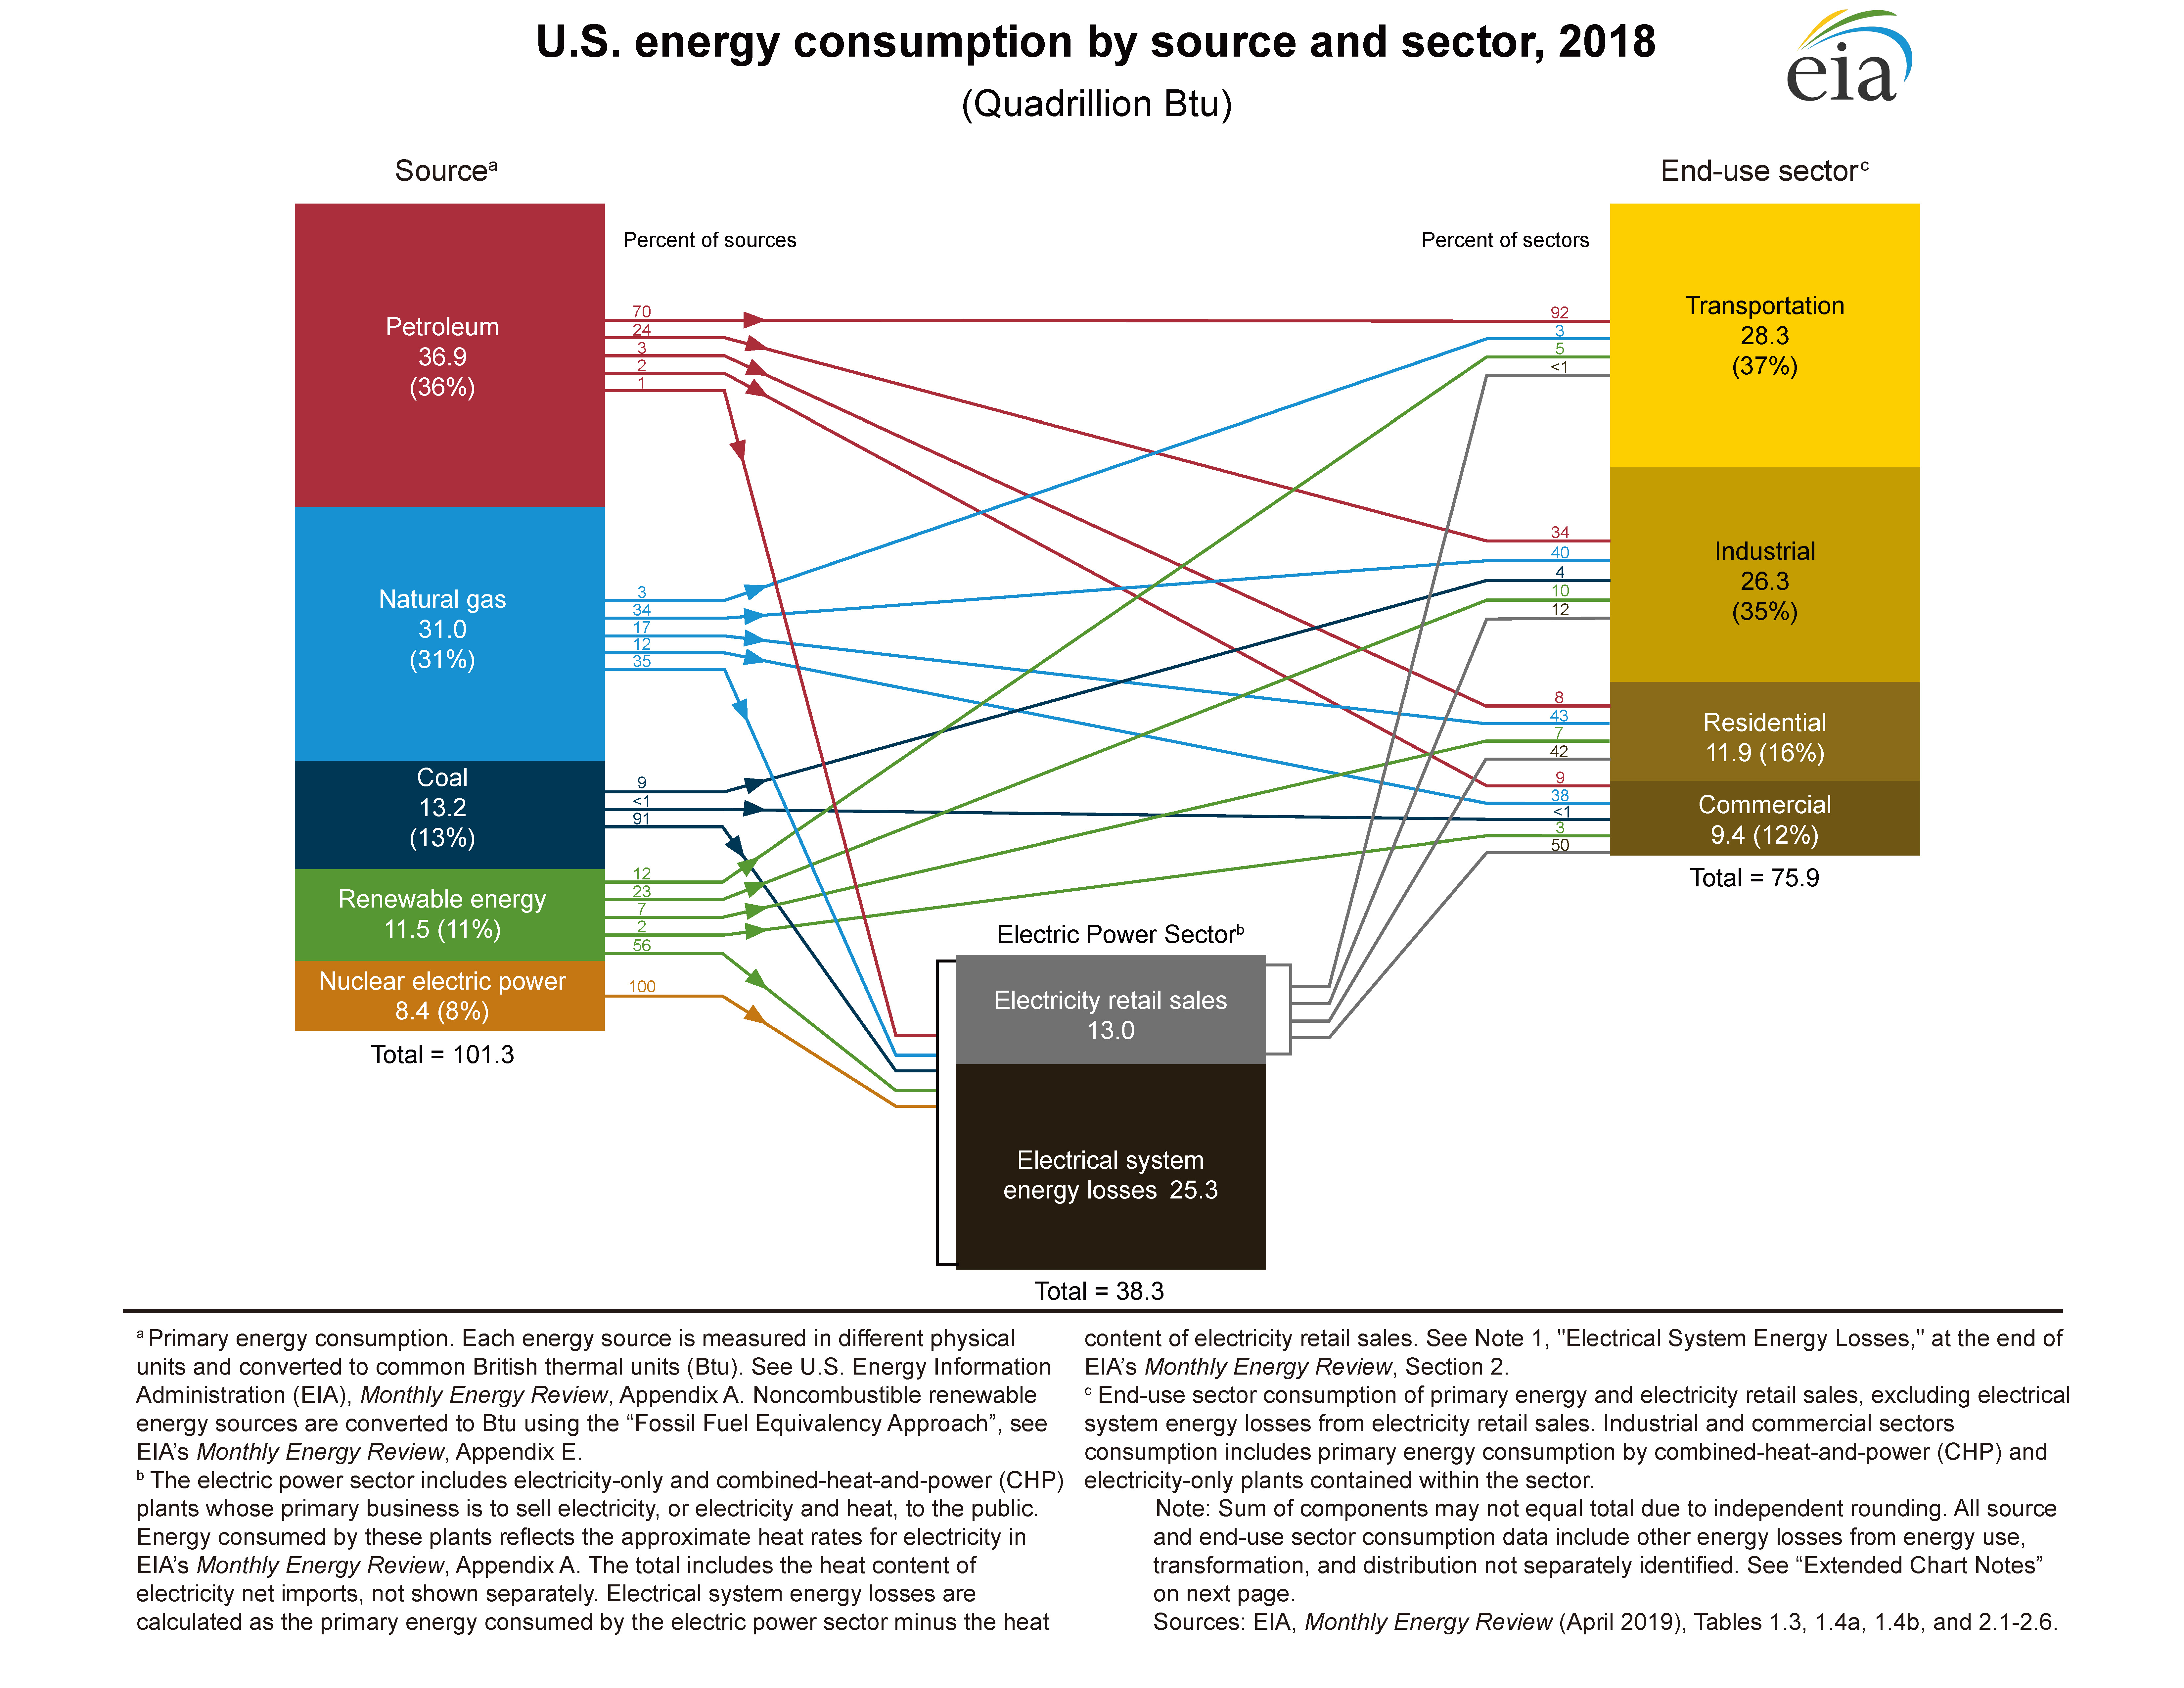
U.S. primary energy consumption by source and sector, 2018.jpg - Zzt514

U.S. primary energy consumption by source and sector, 2017.png - DiscoStu42

US historical energy consumption 1776-2018.svg - Justinkunimune
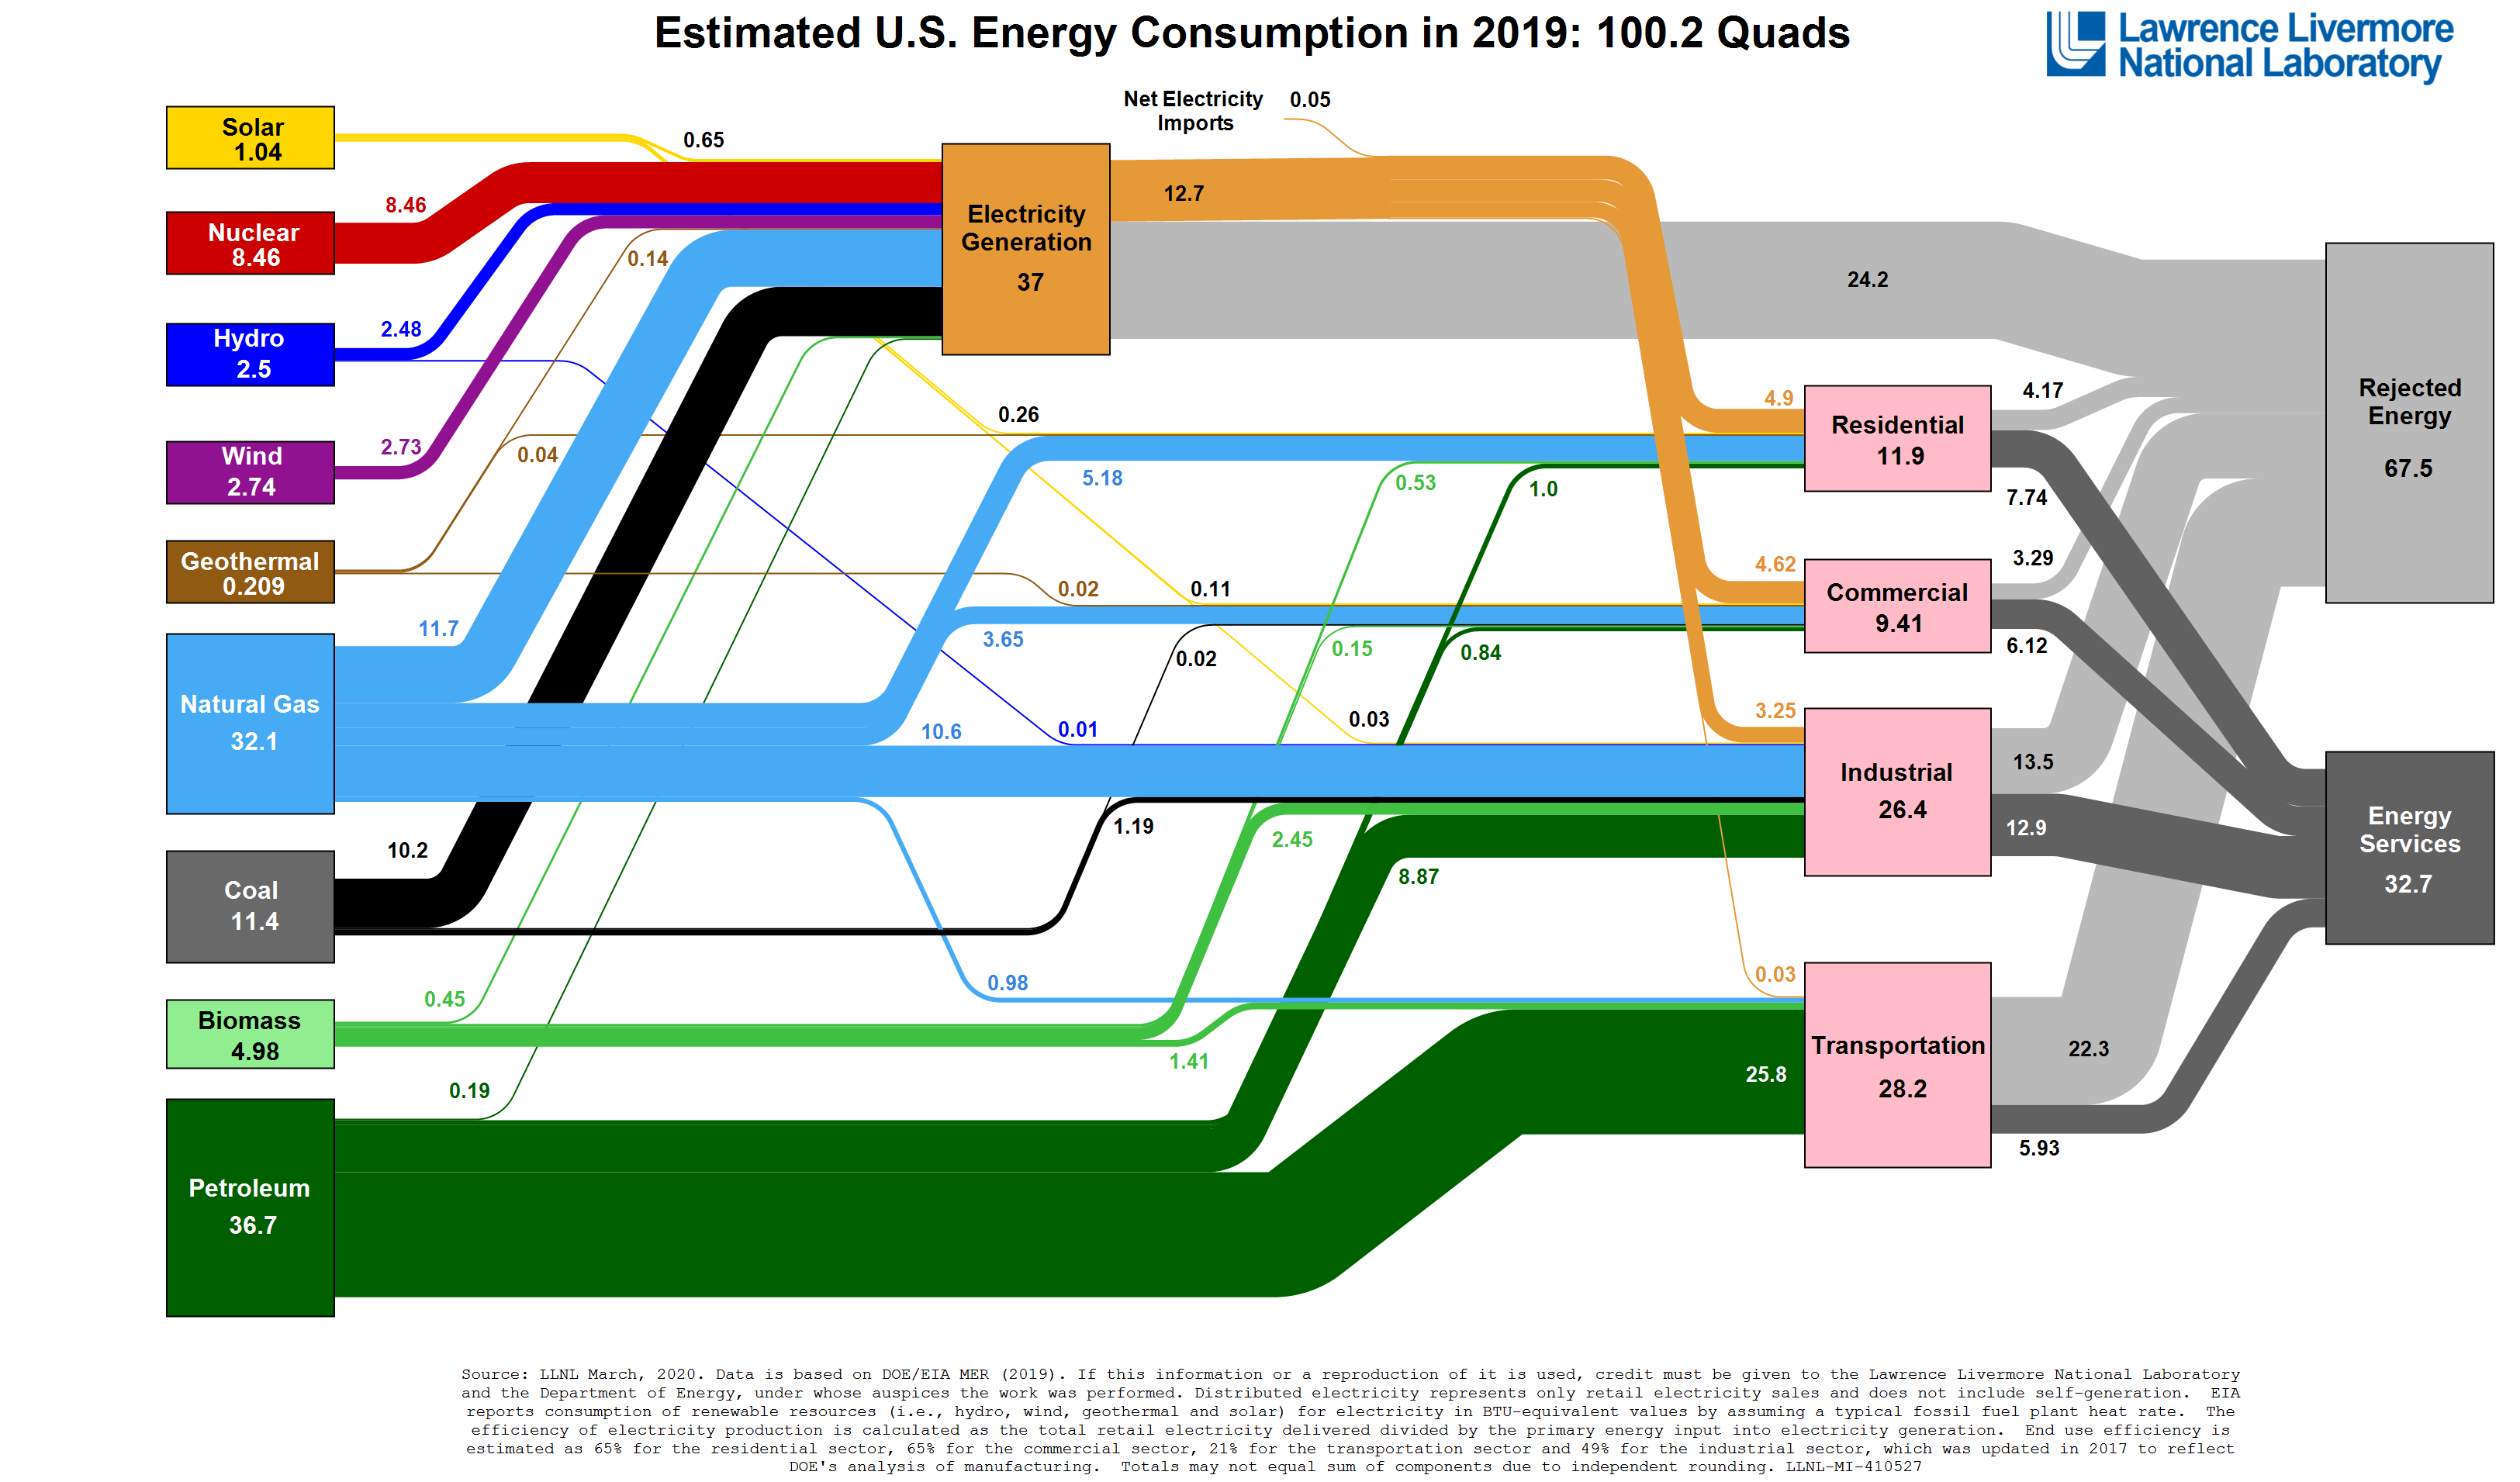
Energy Flow US 2019.png - TGCP

U.S. motor gasoline product supplied (49784554532).png - MarginalCost

US historical energy consumption 1776-2018.png - Aseel zm

Energy flow US 2016.jpg - Aseel zm

New York City hourly weekday electricity demand, February-April 2020 monthly averages (49922955002).png - MarginalCost

Selected North American crude oil prices March 1 through May 13, 2020 (49941454556).png - MarginalCost

2018 Electric Energy Consumption Profile 2018.jpg - Queenwe

2018 State Residential Electricity Costs per kWh.jpg - Queenwe

2018 Per Capita kWh Consumption by State.jpg - Queenwe

Average Residential Costs per kWh for US and selected States 2008-2018.jpg - Queenwe

2018 Electric Generation by State.jpg - Queenwe
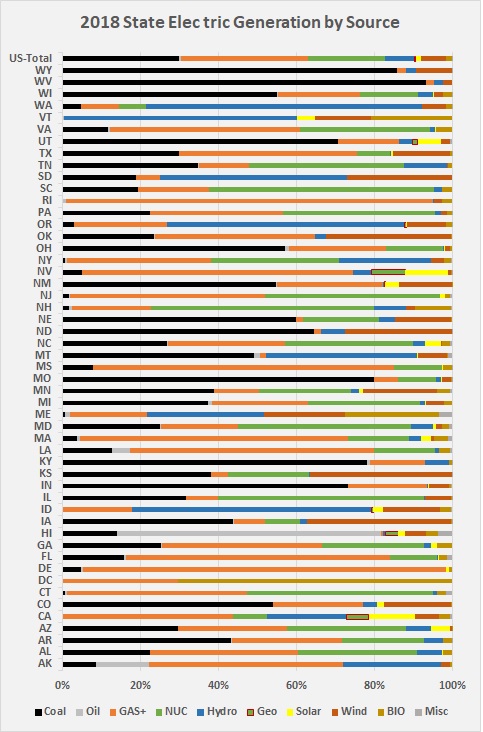
2018 Electric Generation by Source.jpg - Queenwe

2018 Top Ten States Gas.jpg - Queenwe

2018 Top Ten States Coal.jpg - Queenwe
2018 Top Ten States Nuclear.jpg - Queenwe

2018 Top Ten States Petroleum.jpg - Queenwe

1 U.S. liquefied natural gas (LNG) feedgas at selected export terminals in June 1 through October 6, 2020 (50435838458).png - MarginalCost
US Nuclear Electricity 1957-2019.png - Eighttv

US energy consumption.svg - Tallungs

U.S. annual natural gas imports, exports, and net imports in 1950 through 2020 (51231301071).png - MarginalCost

New Mexico crude oil and natural gas production in January 2010 through March 2021 (51247818557).png - MarginalCost

U.S. installed waste-to-energy electricity generating capacity in 1980 through 2027 (52321033217).png - MarginalCost

Timeline of U.S. electricity generation by major energy source.png - Timeshifter

U.S. utility-scale battery storage capacity as of November 2023.svg - Justinkunimune

US historical energy consumption 1776-2024.svg - Justinkunimune