Wikimedi'Òc
Modes d'emploi

Cet album fait partie des albums


AEO 2012 Growth Projection for US Wind and Solar.png - Delphi234
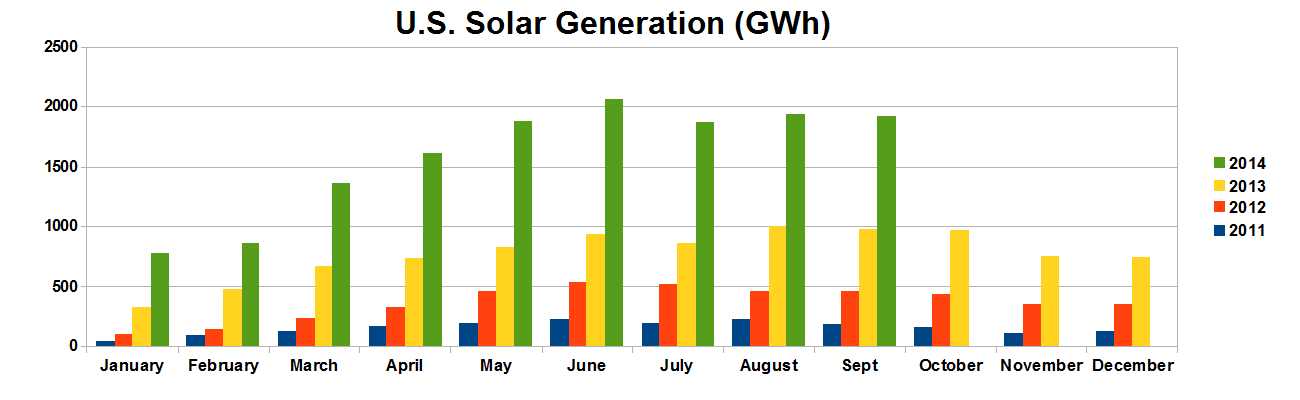
US Solar Generation.png - Delphi234

United States Wind and Solar semilog.png - Delphi234

US monthly solar electricity generation.png - Delphi234

US Solar Electricity Production.png - Delphi234

US Solar Generation 2012.png - Delphi234

US Solar Generation 2008.png - Delphi234

US Monthly Solar Power Generation.png - Delphi234

US Monthly Solar Power Generation.svg - Whidou

US Solar Electricity Production.svg - Grendelkhan

AEO 2013 Projection for US Wind and Solar.png - Delphi234

AEO 2013 Projection for US Wind and Solar-semilog.png - Delphi234

AEO 2013 Growth Projection for US Wind and Solar.png - Delphi234

Top 5 Solar States.png - Plazak

AEO 2014 Growth Projection for US Wind and Solar.png - Delphi234

United States Wind and Solar Generation Percentage-semilog.svg - Delphi234

US Monthly Solar Capacity Factors.png - Plazak

US Solar Generation-2013.svg - Delphi234

Top Five US Solar States.svg - Whidou

United States Photovoltaics Installed Capacity.svg - Delphi234

2014 Solar PV Electric Energy Generation Profile.png - Queenwe

2014 Solar Thermal Electric Energy Generation Profile.png - Queenwe

Major US Solar Farms.png - Queenwe

US Solar Generation-2014.svg - Delphi234

US Solar Generation.svg - Delphi234

2014 NC Solar Electric Profile.png - Queenwe

CA Solar Profile 2014.png - Queenwe

AZ Solar Profile 2014.png - Queenwe

NJ Solar Profile 2014.png - Queenwe

NV Solar Energy Profile 2014.png - Queenwe

AEO 2015 Growth Projection for US Wind and Solar.png - Delphi234

2015 Solar PV Electric Energy Generation Profile.png - Queenwe

2015 Solar Thermal Electric Energy Generation Profile.png - Queenwe

Monthly Solar Distributed 2015.png - Queenwe

2015 Major Solar Farms.png - Queenwe

2015 Solar projects Capacity Factors.png - Queenwe

2015 Top Five Solar States.png - Queenwe

2015 Monthly Solar Generation for NC.png - Queenwe

2014 Monthly Solar Generation for NC.png - Queenwe

2015 Monthly Solar Energy Profile for CA.png - Queenwe

2015 Monthly Solar Profile for AZ.png - Queenwe

2015 Monthly Profile of Solar Energy for NV.png - Queenwe

2015 Monthly Profile of Solar for NJ.png - Queenwe

2006-2015 Solar Electric Energy with 2014-2015 Estimated Distributed Solar.png - Queenwe

Estimated Distributed Solar by States with less than 600 M kWh.png - Queenwe

Top Five States for Distributed Solar.png - Queenwe

US Solar Generation-2015.svg - Delphi234

US annual increase in renewable energy AEO 2015.png - Delphi234

AEO 2016 Growth Projection for US Wind and Solar.png - Delphi234

AEO wind and solar capacity projections.png - Delphi234

US Monthly Solar Capacity Factors.svg - Delphi234

2016 Profile of US Electric Energy produced by SOLAR.jpg - Queenwe

2007-2016 Solar Electric Energy with 2014-2015 Estimated Distributed Solar.jpg - Queenwe

Solar Plant Capacity Factors.jpg - Queenwe

Major Solar Farms.jpg - Queenwe

Minor Solar Farms.jpg - Queenwe

2016 Profile of US Electric Energy Produced by Solar PV.jpg - Queenwe

2016 Profile of US Electric Energy Produced by Solar Thermal.jpg - Queenwe

Top Five Solar States 2016.jpg - Queenwe

2015 Profile for Solar Thermal generated Electric Energy.jpg - Queenwe

2015 Profile of Solar PV Generated Electric Energy.jpg - Queenwe

2016 Top Five States for Distributed Solar.jpg - Queenwe

2016 Estimated Distributed Solar PV for States NOT in the Top Five.jpg - Queenwe

US Solar Generation-2016.svg - Delphi234

Annual Growth of Renewable Energy in the US.svg - Delphi234

US Solar Generation-2017.svg - Delphi234
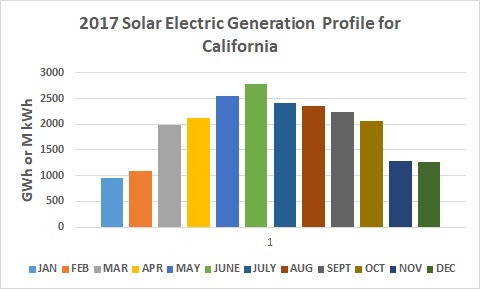
2017 CA Solar Energy Generation Profile.jpg - Queenwe
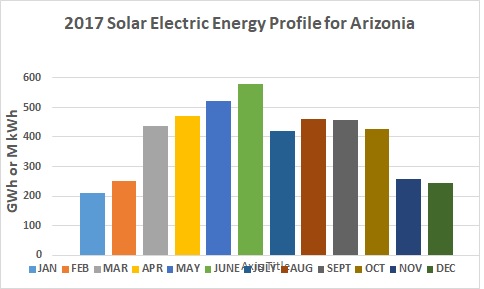
2017 AZ Solar Eneregy Generation Profile.jpg - Queenwe

2017 15KW Vermont Farm Solar Energy Generation Profile.jpg - Queenwe

2017 NC Solar Energy Generation Profile.jpg - Queenwe

2017 NV Solar Energy Generation Profile.jpg - Queenwe
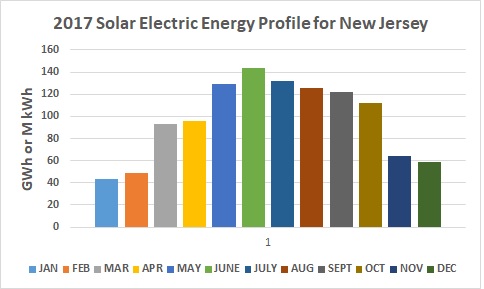
2017 NJ Solar Energy Generation Profile.jpg - Queenwe

2017 TX Solar Energy Generation Profile.jpg - Queenwe

2017 VT Solar Energy Generation Profile.jpg - Queenwe

2017 Solar Generation by State.jpg - Queenwe

U.S. utility-scale fixed-tilt solar photovoltaic system operating capacity tilt angle in 2017 (31693434998).png - MarginalCost

U.S. utility-scale fixed-tilt solar photovoltaic electricity generating capacity by latitude and tilt angle in 2017 (44651426815).png - MarginalCost

U.S. utility-scale fixed-tilt solar photovoltaic electricity generating capacity in 2017 (44840888834).png - MarginalCost

U.S. utility-scale fixed-tilt solar photovoltaic system operating capacity by tilt angle in 2017 (45565971801).png - MarginalCost

Solar Electric Energy including Small.jpg - Queenwe
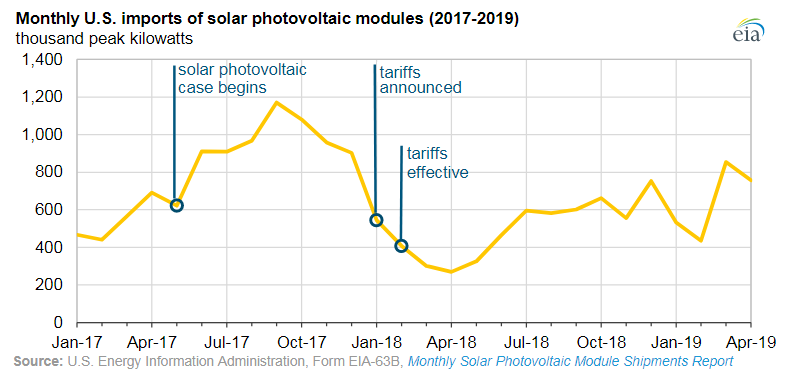
Monthly U.S. imports of solar photovoltaic modules, January 2017 through April 2019 (48527575091).png - MarginalCost

Annual U.S. solar photovoltaic shipments in 2010 through 2021 (52326961645).png - MarginalCost

2022 Wind and solar energy generation leaders among U.S. states - variable width bar chart - IEA data.svg - RCraig09

2000- Clean power installation - wind, solar, storage - US.svg - RCraig09
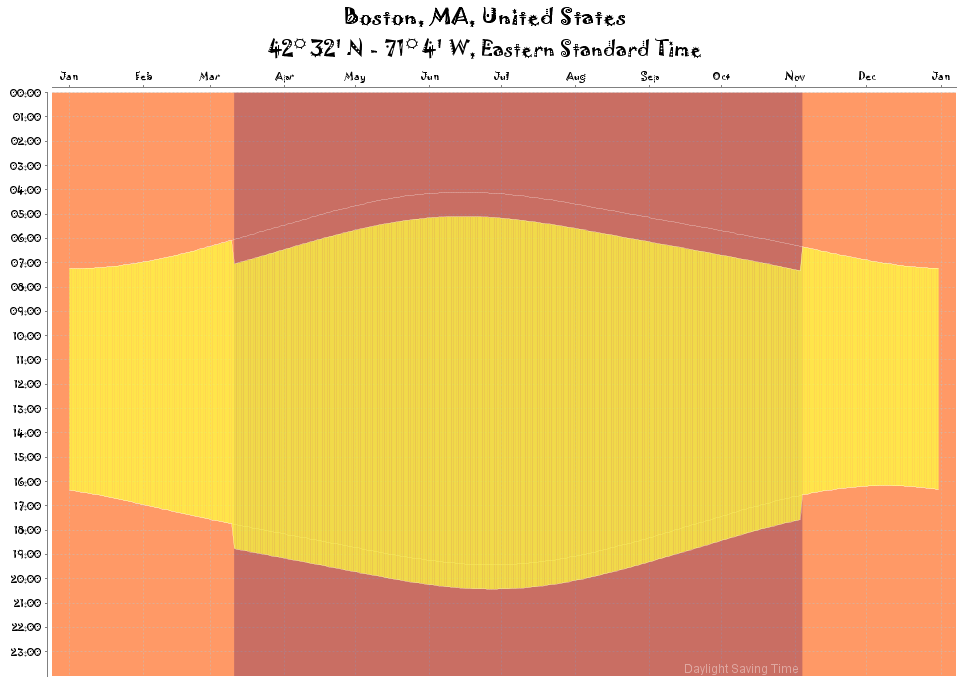
Boston MA DaylightChart.png - SualehFatehi