Wikimedi'Òc
Modes d'emploi

Cet album fait partie des albums


US Electricity from renewables.png - Plazak

Projected US Renewable Electric Capacity.jpg - Plazak

US Percent of Energy Exported-Projected-2050.png - Delphi234

US Renewable Electricity by Source.png - Plazak

Sources of Total US Renewable Energy.png - Cmdrjameson

United States Renewable Generation from EIA AEO 2014.png - Delphi234

Renewable Electricity Production in the United States.svg - Delphi234

Renewable Electric Energy Profile.png - Queenwe

2014 Geo Thermal Electric Energy Generation Profile.png - Queenwe

2014 Wind Electric Energy Generation Profile.png - Queenwe

Renewable Electric Energy 10yr Actual 5yr predicted.png - Queenwe

2004-2014 Renewable Electric Energy profile.png - Queenwe

2015-2019 Capacity Projections.png - Queenwe

Renewable Electric Energy 2004-2015 Actual 2016-2019 Projected.png - Queenwe

2015 Other Biomass Electric Energy Generation Profile.png - Queenwe
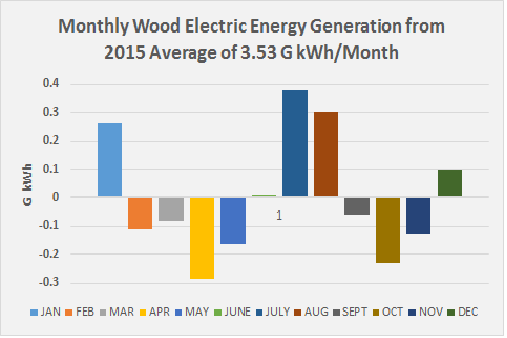
2015 Wood Electric Energy Generation Profile.png - Queenwe

Monthly US Hydro Profile 2015.png - Queenwe
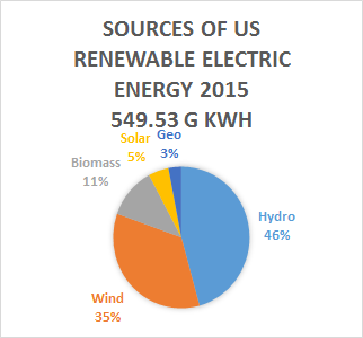
2015 US Renewables Pie Chart.png - Queenwe

2014 Contributions by Renewables to US Total Energy (11-).png - Queenwe

10 YR Profile of Renewables Electric Energy Generation in US.png - Queenwe

2015 Top Five States for Renewable Electric Energy.png - Queenwe
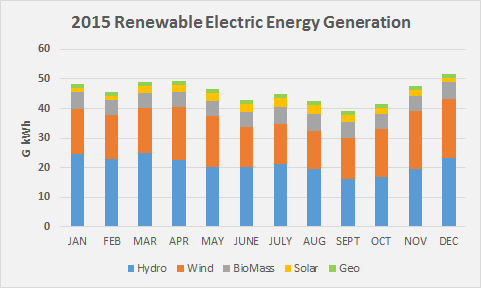
2015 Renewable Electric Energy Generation.png - Queenwe

2015 Top Five Wind States.png - Queenwe
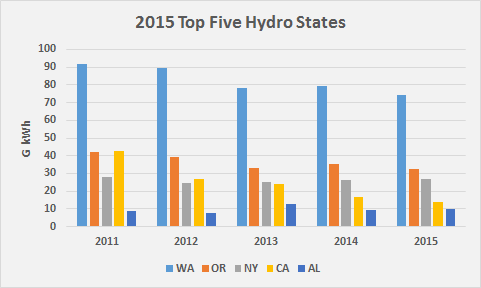
2015 Top Five Hydro States.png - Queenwe

Renewable energy production in California.svg - Delphi234

US annual increase in renewable energy AEO 2015.png - Delphi234

2005-2016 Renewable Electric Energy Profile.jpg - Queenwe

2005-2016 Profile of Renewable Electric Energy Generation in the US.jpg - Queenwe

2016 Source of US Renewable Electric Energy 609.44.jpg - Queenwe

2016 Top Five States for Renewable Electric Energy.png - Queenwe

2016 Profile of Renewable Electric Energy.jpg - Queenwe

2016 Top HYDRO States.jpg - Queenwe

10 yr Profile of Wind Generated Electric Energy.jpg - Queenwe

Renewable portfolio standards for selected U.S. states, 2010 through 2050 (46504655934).png - MarginalCost

2018 State Hydro Electric Generation.jpg - Queenwe

2018 State Geothermal Electric Generation.jpg - Queenwe
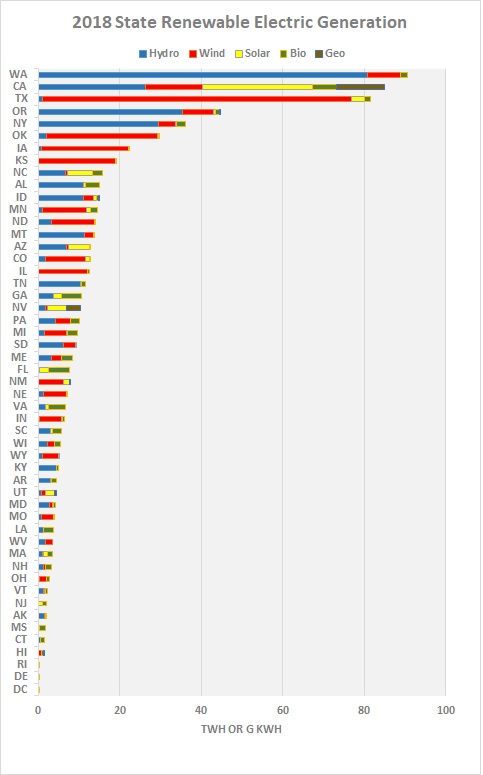
2018 State Renewable Electric Generation.jpg - Queenwe

2018 State Utility Solar Electric Generation.jpg - Queenwe

2018 Top Ten States Biomass.jpg - Queenwe

2018 Top Ten States Geothermal.jpg - Queenwe

2018 Top Ten States Hydro.jpg - Queenwe

2018 Top Ten States Solar.jpg - Queenwe
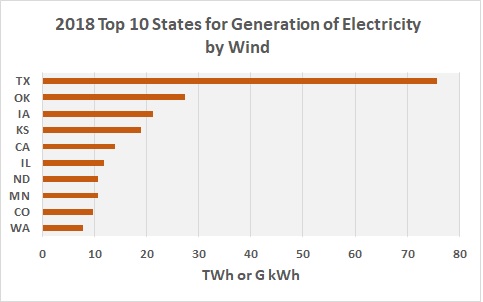
2018 Top Ten States Wind.jpg - Queenwe

20220314 Renewable electricity generation - United States.svg - RCraig09

2022 Wind and solar energy generation leaders among U.S. states - variable width bar chart - IEA data.svg - RCraig09

1776 Historical energy consumption - U.S. - EIA data.svg - Turbojet

2000- Clean power installation - wind, solar, storage - US.svg - RCraig09

Timeline of electricity from renewable sources in the United States.png - Timeshifter

US monthly renewable electricity generation.png - Delphi234