Wikimedi'Òc
Modes d'emploi

Cet album fait partie des albums
Cet album photos contient les sous-albums suivants :


Life expectancy vs healthcare spending.jpg - Timeshifter

World Wide Smartphone Sales.png - TheKiteGuy

Measles Canada 1924-2018.png - Julius Senegal

Masern in Kanada, 1924-2018.png - Julius Senegal

Mauna Loa Carbon Dioxide.svg - StefanInaktiv

PlotEditorsCOMMONS statswikimedia.png - Timeshifter

UK electricity production by source.png - Bellowhead678

MedEditorTrends.png - Doc James

En Wikipedia Articles.png - HenkvD

Statistics of uploads vs deletes from Commons app 01.png - Misaochan

Visites Mensuelles sur DeepL.png - Marcel Roblin

Wikimedia Commons active users with over 10,000 edits January 2015 to April 2018.png - Fæ

Asbestos-world-production-1900-2100.jpg - Wjfox2005
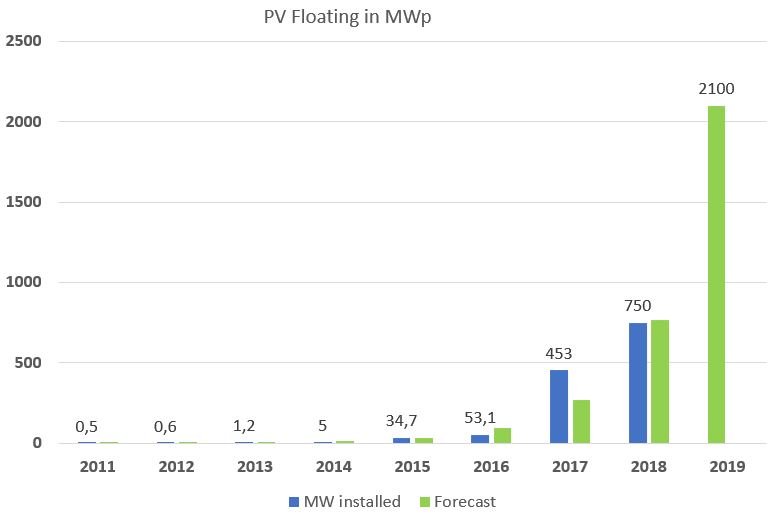
FPV installed capacity.jpg - Rosa Clot Marco

OceanHeatContent Cheng-en.svg - DeWikiMan
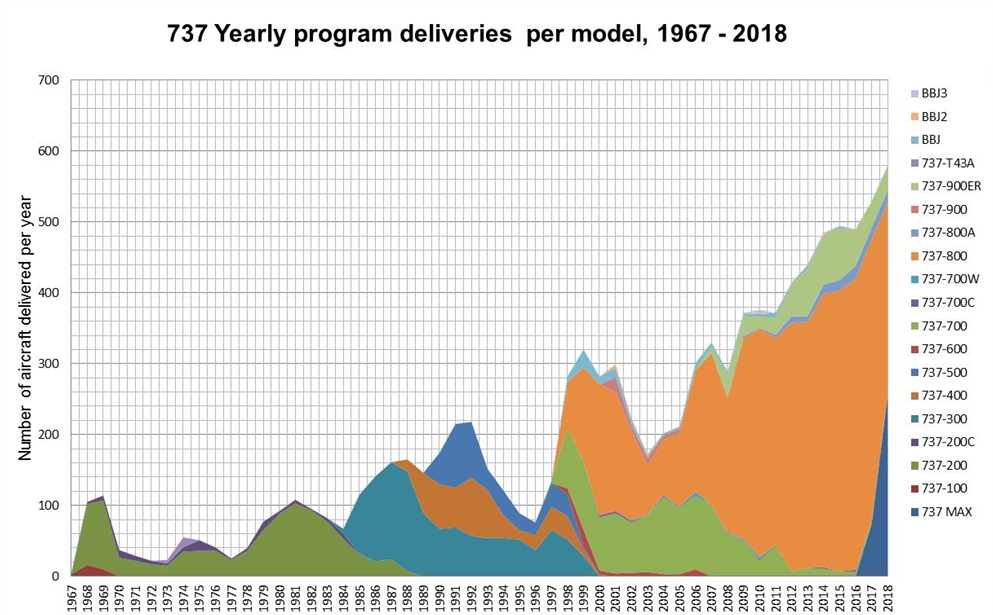
737-deliveries-per-year-1967-2018.png - Marc Lacoste

737 vs a320 family deliveries per model 1967-2018.png - Marc Lacoste
Moore's Law Transistor Count 1971-2018.png - Apeman2001

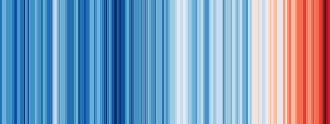
20190721 STACKED warming stripes - all countries - Climate Lab Book (Ed Hawkins).png - RCraig09

20181204 Warming stripes (global, WMO, 1850-2018) - Climate Lab Book (Ed Hawkins).png - RCraig09

20190907 STACKED global warming stripes (large legends) - derived from Ed Hawkins.png - RCraig09

20190909 STACKED country warming stripes AND global average (1901- ).png - RCraig09

20190912 Stacked warming stripes - atmospheric layers (derived from Ed Hawkins).png - RCraig09

Amazon over time.png - RequeteSerrano

Petroleum production consumption.png - Mortezarahimi3rd
20191206 Warming stripes at COP25 - John Englart flickr.jpg - RCraig09

20181204 Warming stripes (global, WMO, 1850-2018) - Climate Lab Book (Ed Hawkins).svg - RCraig09

Atmospheric CO₂ concentration, OWID.svg - Fæ

Global CO₂ atmospheric concentration, OWID.svg - Fæ

Methane (CH₄) atmospheric concentration, OWID.svg - Fæ

Total number of fatal shark attacks, OWID.svg - Fæ

Total shark attacks per year, OWID.svg - Fæ

Daily hours spent with digital media, OWID.svg - Fæ

Per capita meat consumption in the EU28 (OECD, 1990-2018), OWID.svg - Fæ

Per capita meat consumption in the United States (USDA, 1970-2018), OWID.svg - Fæ

Global reported natural disasters by type, OWID.svg - Fæ

Measured and expected atmospheric concentrations of CFC-11, OWID.svg - Fæ

Number of cases of killings of journalists and associated media personnel, OWID.svg - Fæ

Remittance costs as a proportion of the amount remitted, OWID.svg - Fæ

Hydropower generation by region, OWID.svg - Fæ

Pista Yield chart.png - Mortezarahimi3rd

PotatoYeild chart.png - Mortezarahimi3rd
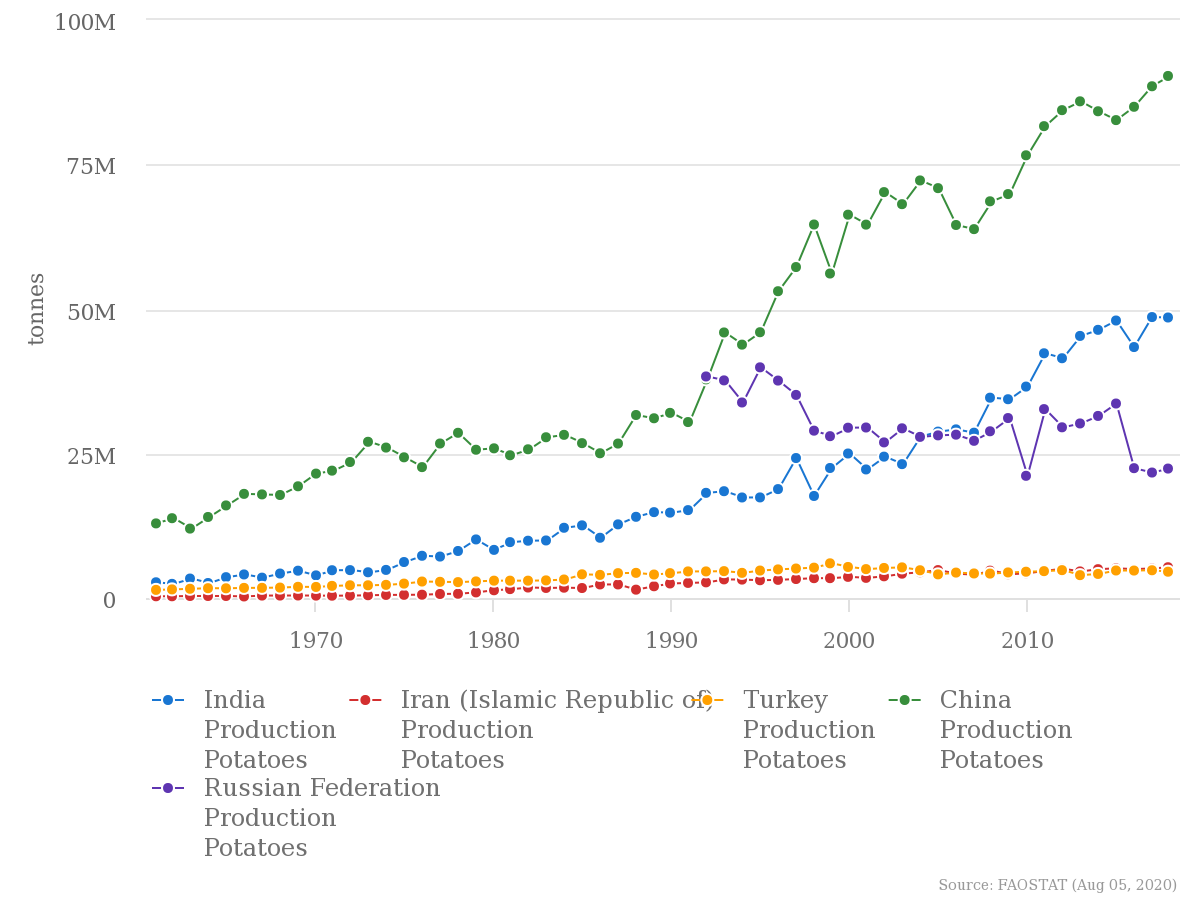
Potato chart.png - Mortezarahimi3rd

Walnut chart.png - Mortezarahimi3rd

Eurostat EU-27 immigration and emigration 2013-2018.png - 1Kwords

Co2-emissions-by-fuel-line1800-2018.svg - IcedWave

Numbers of autocracies and democracies.png - Wikideas1
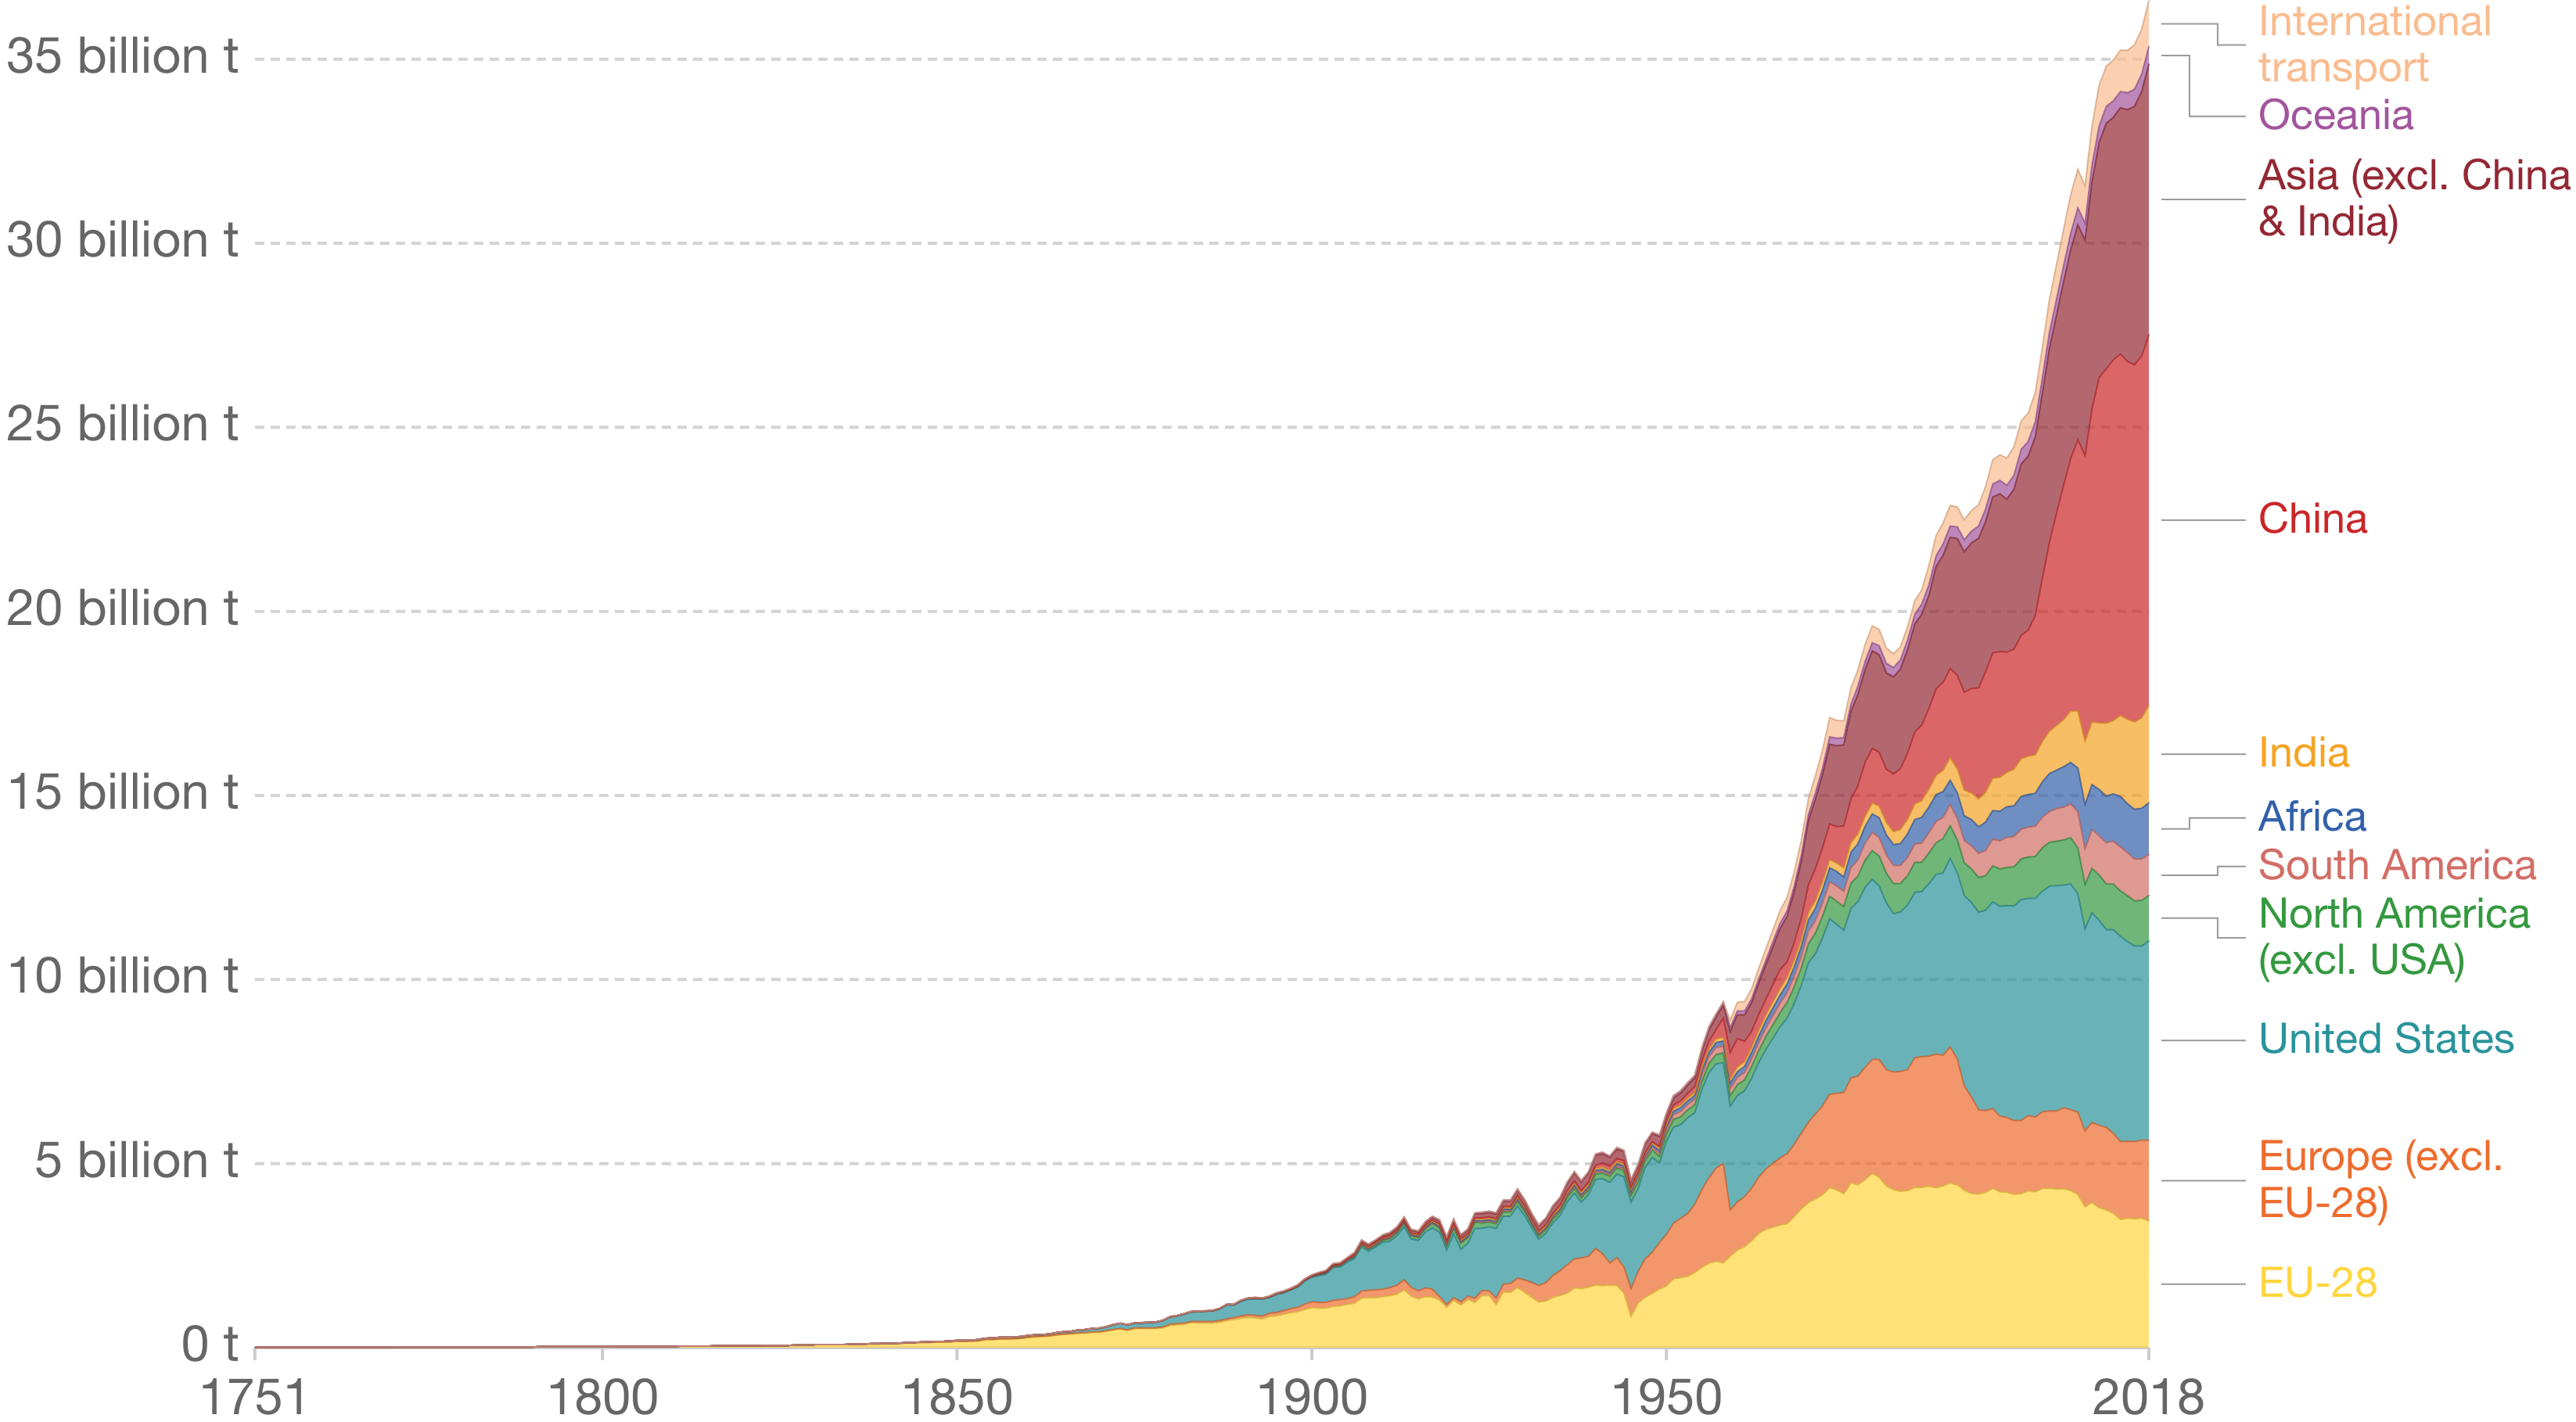
Annual-CO2-emissions-by-region.png - Wikideas1

CO2 emissions fraction of Aviation (%).png - Marc Lacoste

Direct economic loss attributed to disasters in Mexico from 2005, OWID.png - Dolphyb

Number-of-severely-food-insecure-people-by-region.png - Dolphyb

Top 3 countries' projected population.svg - Normchou

Zunahme Weltverbauch nach Fleischarten bis 2018.svg - Raidxzy

Soja-Anbauflächen der fünf wichtigsten Produktionsländer.svg - Leyo

Jamaica electricity production.svg - Tallungs

Jamaica renewable electricity production.svg - Tallungs

Jordan electricity production.svg - Tallungs

US Monthly Wind Generated Electricity.svg - Delphi234

Inorganic Perovskites Efficiency Evolution and Structure.png - Wikidave20

Efficiency history of inorganic perovskites, basic structure.jpg - Wikidave20

Historical economic growth of Japan.jpg - Afus199620

GDP per capita development in East Asia.svg - Afus199620

GPD per capita development of Kenya.svg - Afus199620

GDP per capita Baltics.svg - Afus199620

Daily-per-capita-caloric-supply-countries.svg - Afus199620

Total annual meat consumption by region.png - Prototyperspective

Total annual meat consumption by type of meat.png - Prototyperspective

Per capita annual meat consumption by region.png - Prototyperspective
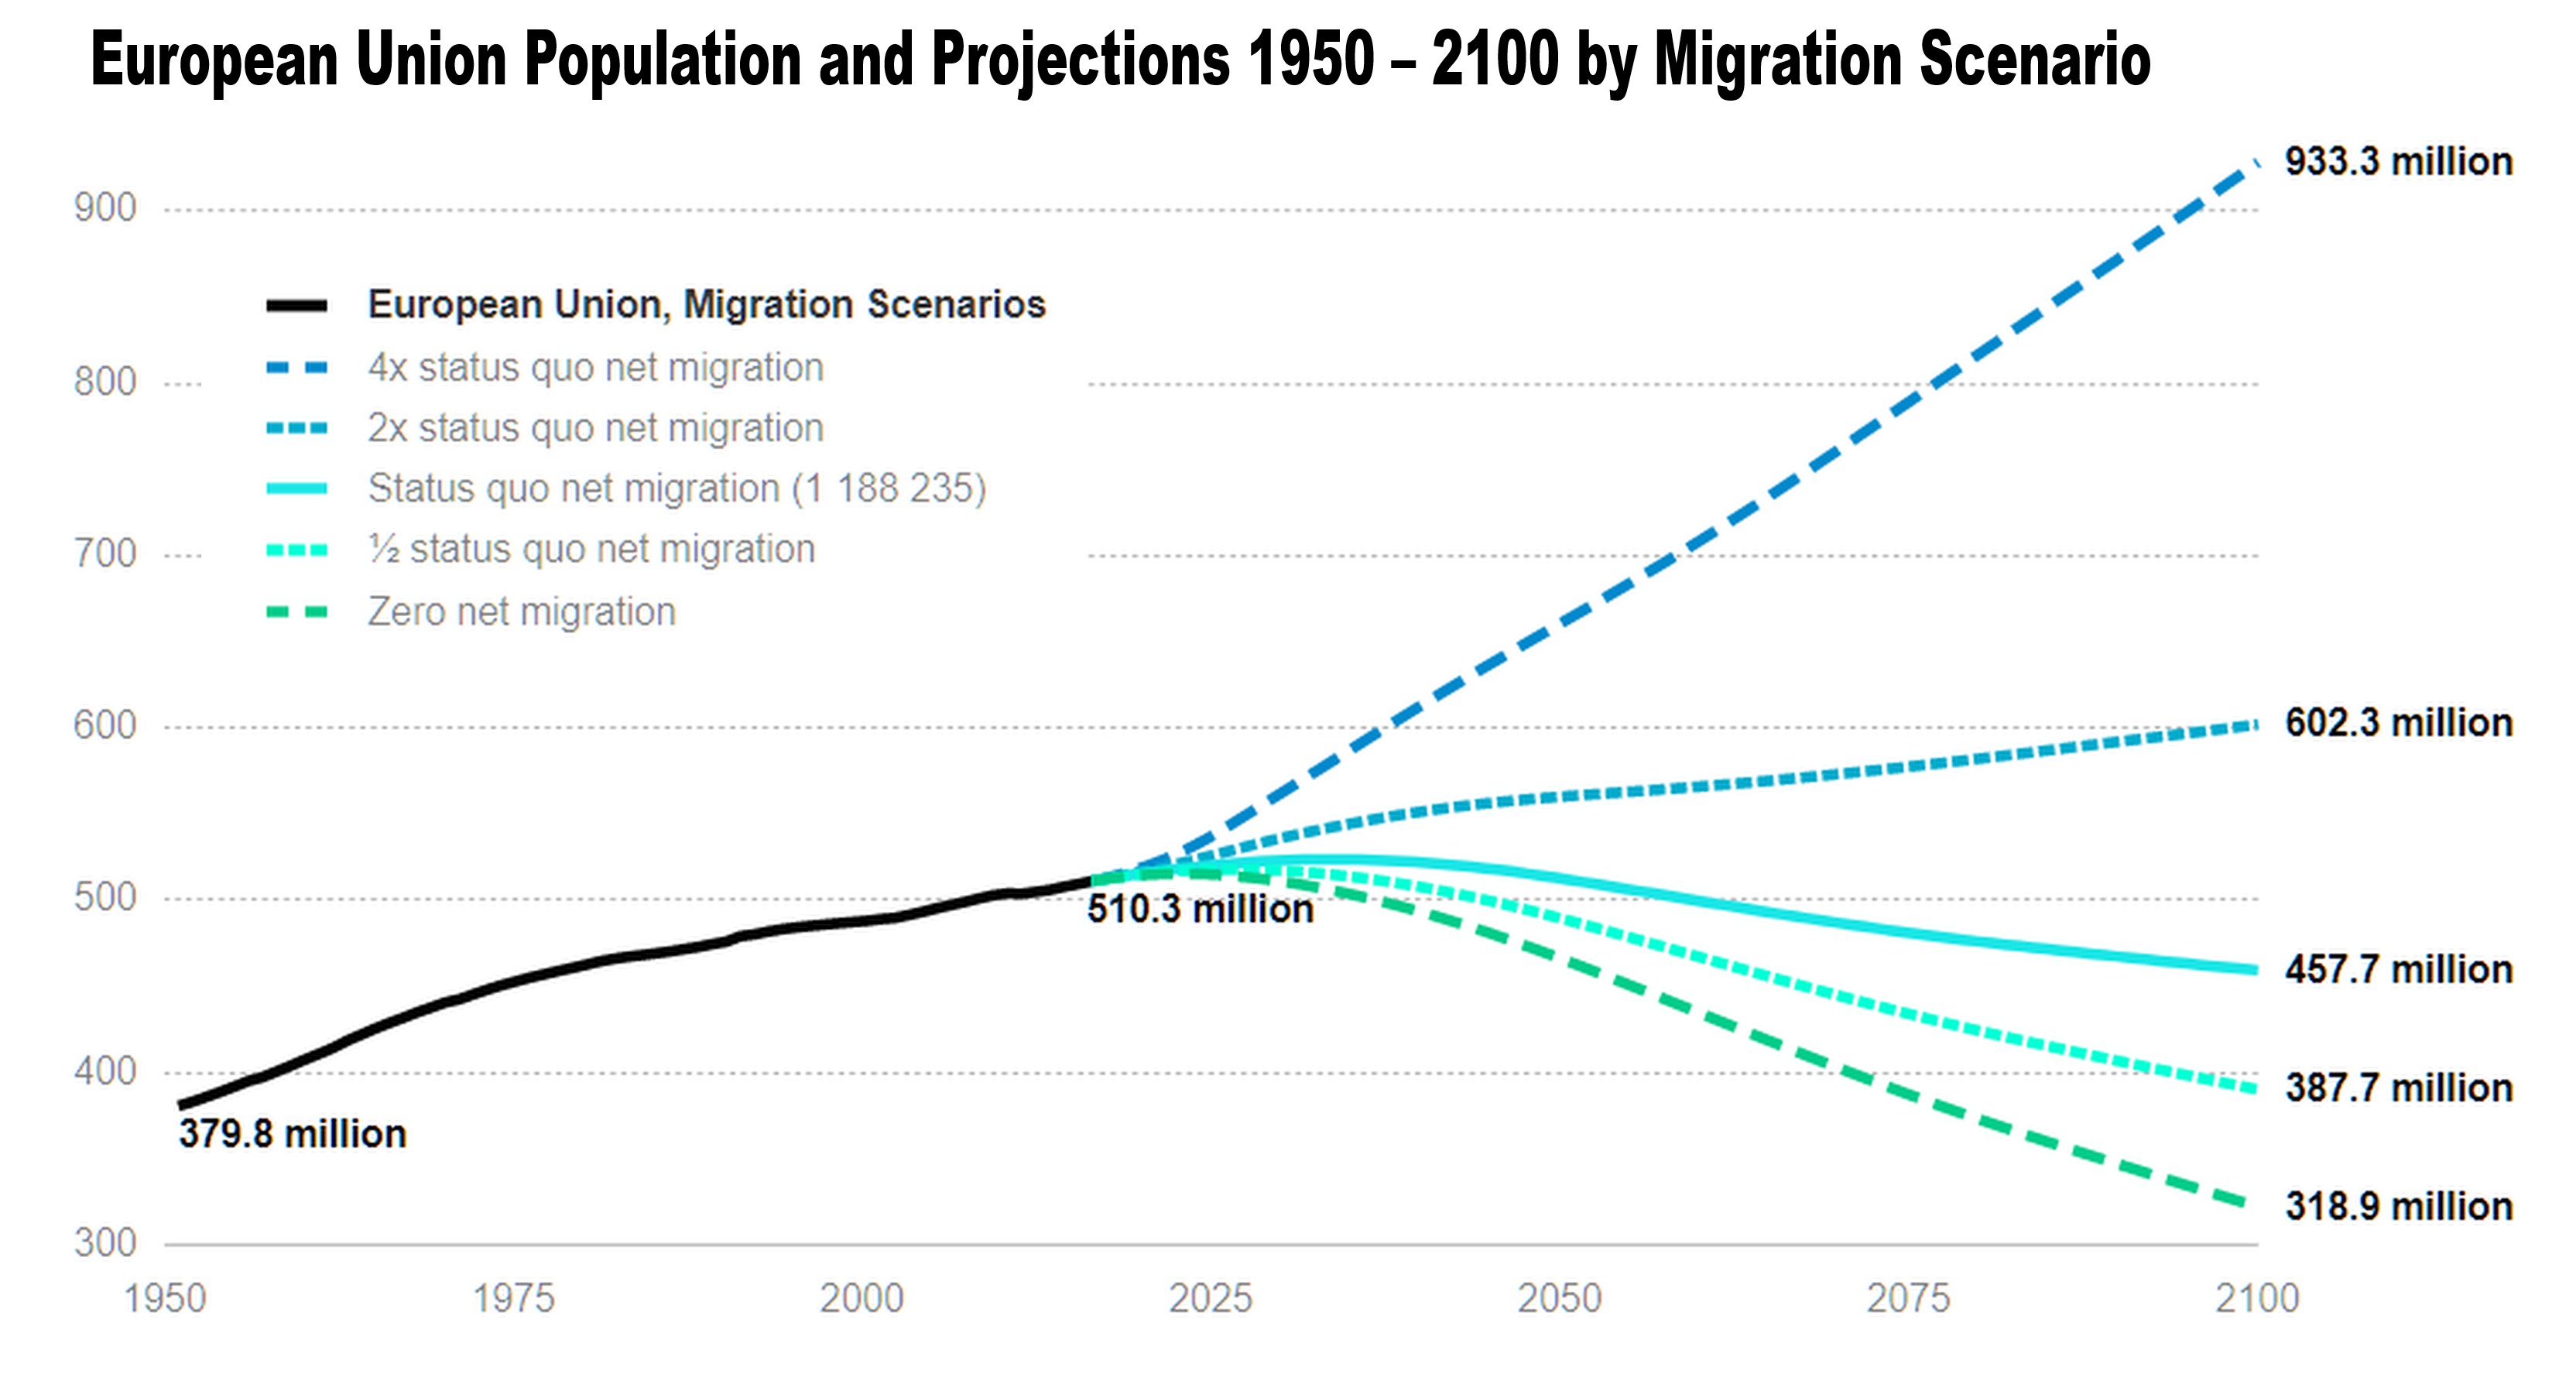
European Union Population Projections.jpg - Raquel Baranow

European Union Population Projections by Fertility Scenario.jpg - Raquel Baranow

Wild-fish-catch-gear-type.svg - PJ Geest

Population projections of France by the UN up to 2100.svg - Tweedle

GDP per capita development of Niger.svg - Afus199620

GDP per capita development of Bosnia and Herzegovina.svg - Afus199620

GDP per capita development of Burundi.svg - Afus199620

GDP per capita develoment of Haiti.svg - Afus199620

GDP per capita development of Greece.svg - Afus199620

GDP per capita development of Moldova.svg - Afus199620

Alcohol consumption rate in the United Kingdom.svg - Tweedle

GDP per capita development in Europe, 1820 to 2018.svg - Afus199620

Real GDP per capita development of Uzbekistan.svg - Afus199620

GDP per capita development of Cuba.svg - Afus199620

GDP per capita development in Central Asia.svg - Afus199620

Funding for climate research in the natural and technical sciences versus the social sciences and humanities.jpg - Prototyperspective

GDP per capita development of Nigeria.svg - Afus199620

GDP per capita development development of Ghana.svg - Afus199620

Duration of the yearly snow cover ring-width reconstruction together with modelled record for the Alps.webp - Prototyperspective

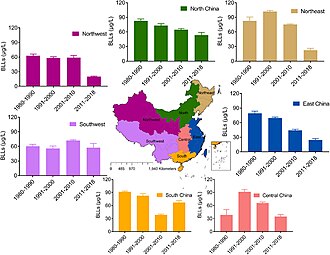
Trend of blood lead levels in Chinese adults in different regions from 1980 to 2018.jpg - Dustfreeworld

Timeline of the annual number of journal publications about climate litigation.jpg - Prototyperspective

Ace-north-atlantic-hurricanes (OWID 0040).png - Jason.nlw

Annual-fish-catch-taxa (OWID 0043).png - Jason.nlw

Biomass-fish-stocks-region (OWID 0078).png - Jason.nlw

Change-in-cfc-11-concentrations (OWID 0157).png - Jason.nlw
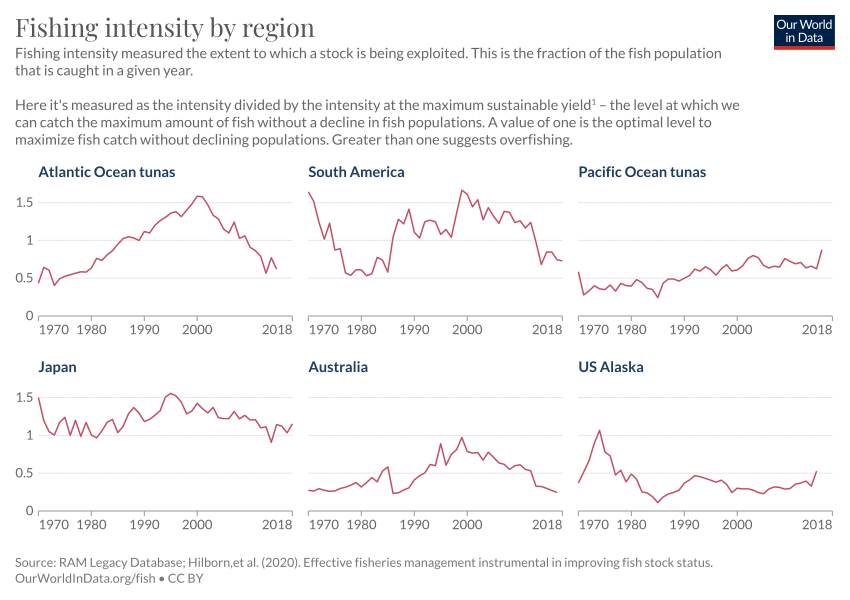
Fishing-pressure-by-region (OWID 0427).png - Jason.nlw
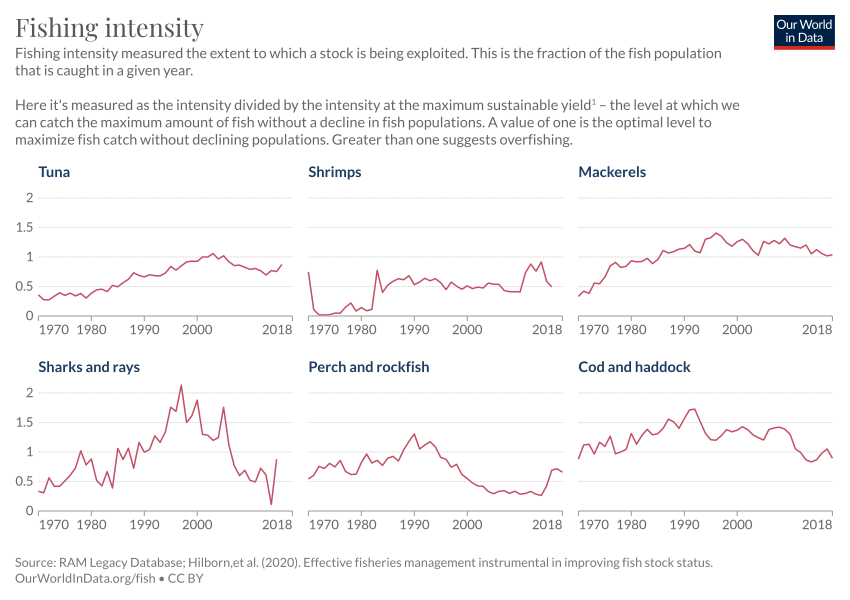
Fishing-pressure-by-taxa (OWID 0428).png - Jason.nlw
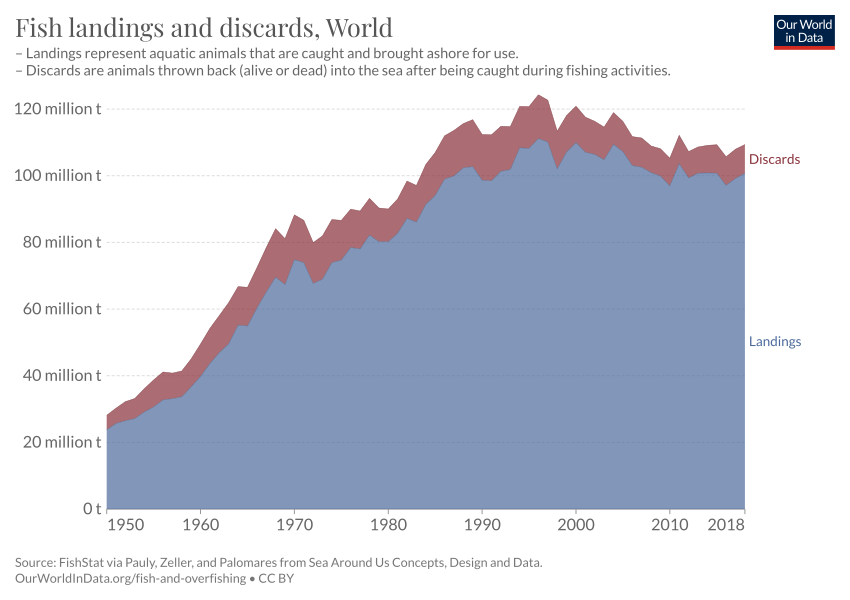
Fish-landings-and-discards (OWID 0434).png - Jason.nlw

Fish-catch-gear-type (OWID 0440).png - Jason.nlw

Global-living-planet-index (OWID 0539).png - Jason.nlw

Ozone-depleting-substances-index (OWID 0684).png - Jason.nlw

Per-capita-meat-usa (OWID 0751).png - Jason.nlw

Per-capita-meat-eu28 (OWID 0754).png - Jason.nlw

Renewable-water-resources-per-capita (OWID 0862).png - Jason.nlw

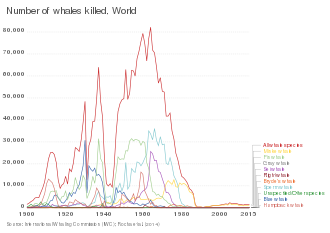
Whale-catch (OWID 1109).png - Jason.nlw

Graph of papers published in Economic Research by year.png - Freedom4U

Pneumonia-mortality-by-age.jpg - Ozzie10aaaa

Israel war crimes ngram views.png - Vice regent

Timeline from 1975 showing the successful development of therapeutic antibodies and their applications.webp - DoctorNaturopath

GDP per capita development in Australia and New Zealand.svg - Afus199620

Total amount of gold and hybrid article processing charges (APCs) per publisher per year.png - Prototyperspective

Daily per-capita food energy supply of countries.svg - Getsnoopy

Daily per-capita food energy supply of regions.svg - Getsnoopy

Improved-weather-forecasting 7463.png - PJ Geest

GDP per capita development in Iran 1950-2018.svg - Fedjmike

Deforestation continues to expand within the Amazon forest system.webp - Prototyperspective

Mammal cloning publications over time and breed differences.webp - Prototyperspective

Number of whales killed, OWID.svg - Prototyperspective

GDP per capita development in South Asia.svg - Afus199620

Fish-discards (OWID 0433).png - Jason.nlw

Brazil GDP per capita, 1800 to 2018 (Maddison Project Database 2020).svg - Yeeno