Wikimedi'Òc
Modes d'emploi

Cet album fait partie des albums
Cet album photos contient les sous-albums suivants :


Gv-mais-eu.PNG - Fafner

10 Principales cultures 2007.svg - Spedona

Taula de destinació de tots els cereals consumits.png - KRLS

Annual report of the Secretary of the Board of Agriculture (1894) (19361007752).jpg - SteinsplitterBot

Anbau Gv-Mais 2016.png - Kontrollstellekundl

Land equivalent ratio.png - Tobi Kellner
Land Equivalent Ratio xcf file.xcf - Bürgerentscheid

Land Equivalent Ratio of polyculture vs monoculture.png - Tobi Kellner
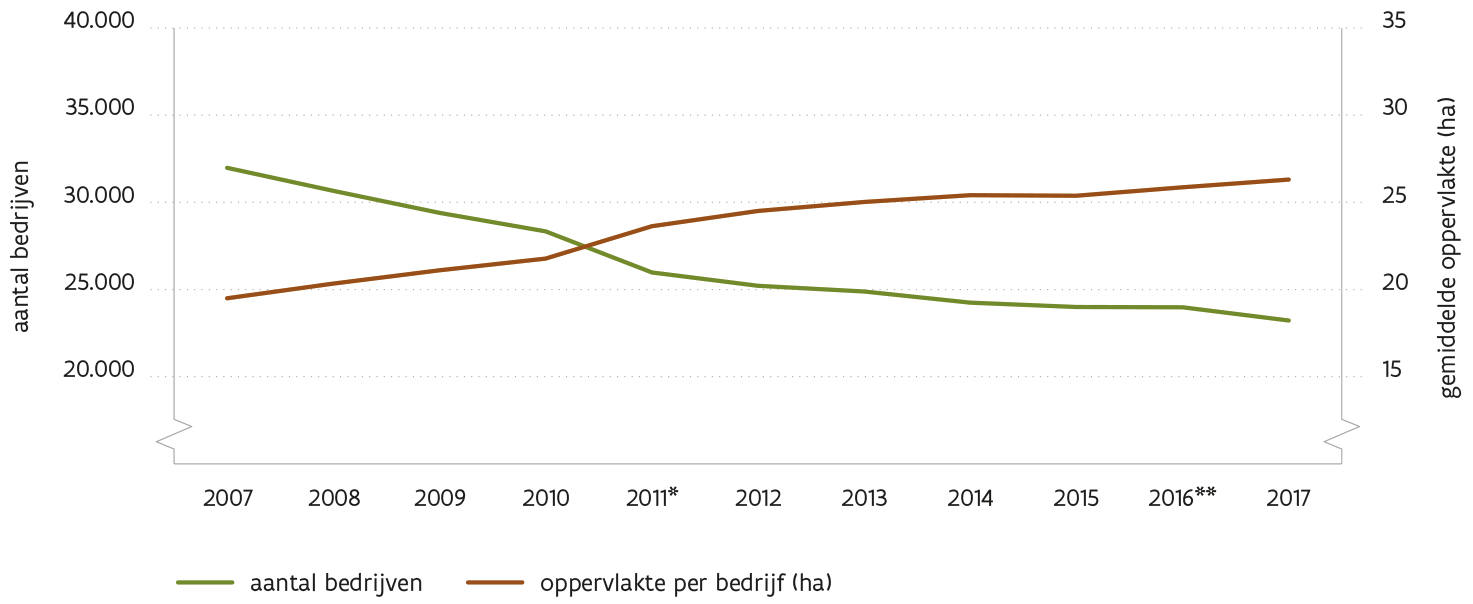
HST2 FIG1 aantal bedrijven en gem opp.png - Dep lv ams

HST2 FIG42 VLTB ecoefficientie.png - Dep lv ams

Wölfe Schweiz genetische Nachweise.png - Sciencia58

Wolf Herdenschutz Frankreich.png - Sciencia58

Wolf Angriffe auf Weidetiere Tageszeiten.png - Sciencia58

Share of agriculture in total employment, OWID.svg - Fæ

Crop production in England over the long-term, million tonnes, OWID.svg - Fæ

Crop yields of cereals and pulses, OWID.svg - Fæ

Land use per 100 kilocalories by food and production type, OWID.svg - Fæ

Land use per unit protein by food and production system, OWID.svg - Fæ

Long-term agricultural yields in the United Kingdom, OWID.svg - Fæ

Long-term cereal yields in the United Kingdom, OWID.svg - Fæ

Long-term wheat yields in Europe, OWID.svg - Fæ

Tractors per 100 square kilometres of arable land, OWID.svg - Fæ

Insecticide use, OWID.svg - Fæ

Serie storica miglio con regressione.png - Lovepeacejoy404

Serie storica del miglio in India.png - Lovepeacejoy404

Serie storica grano con regressione.png - Lovepeacejoy404

Serie storica del grano in India.png - Lovepeacejoy404

Wolf (Canis lupus) Populationsdichte.png - Sciencia58

PotatoYeild chart.png - Mortezarahimi3rd
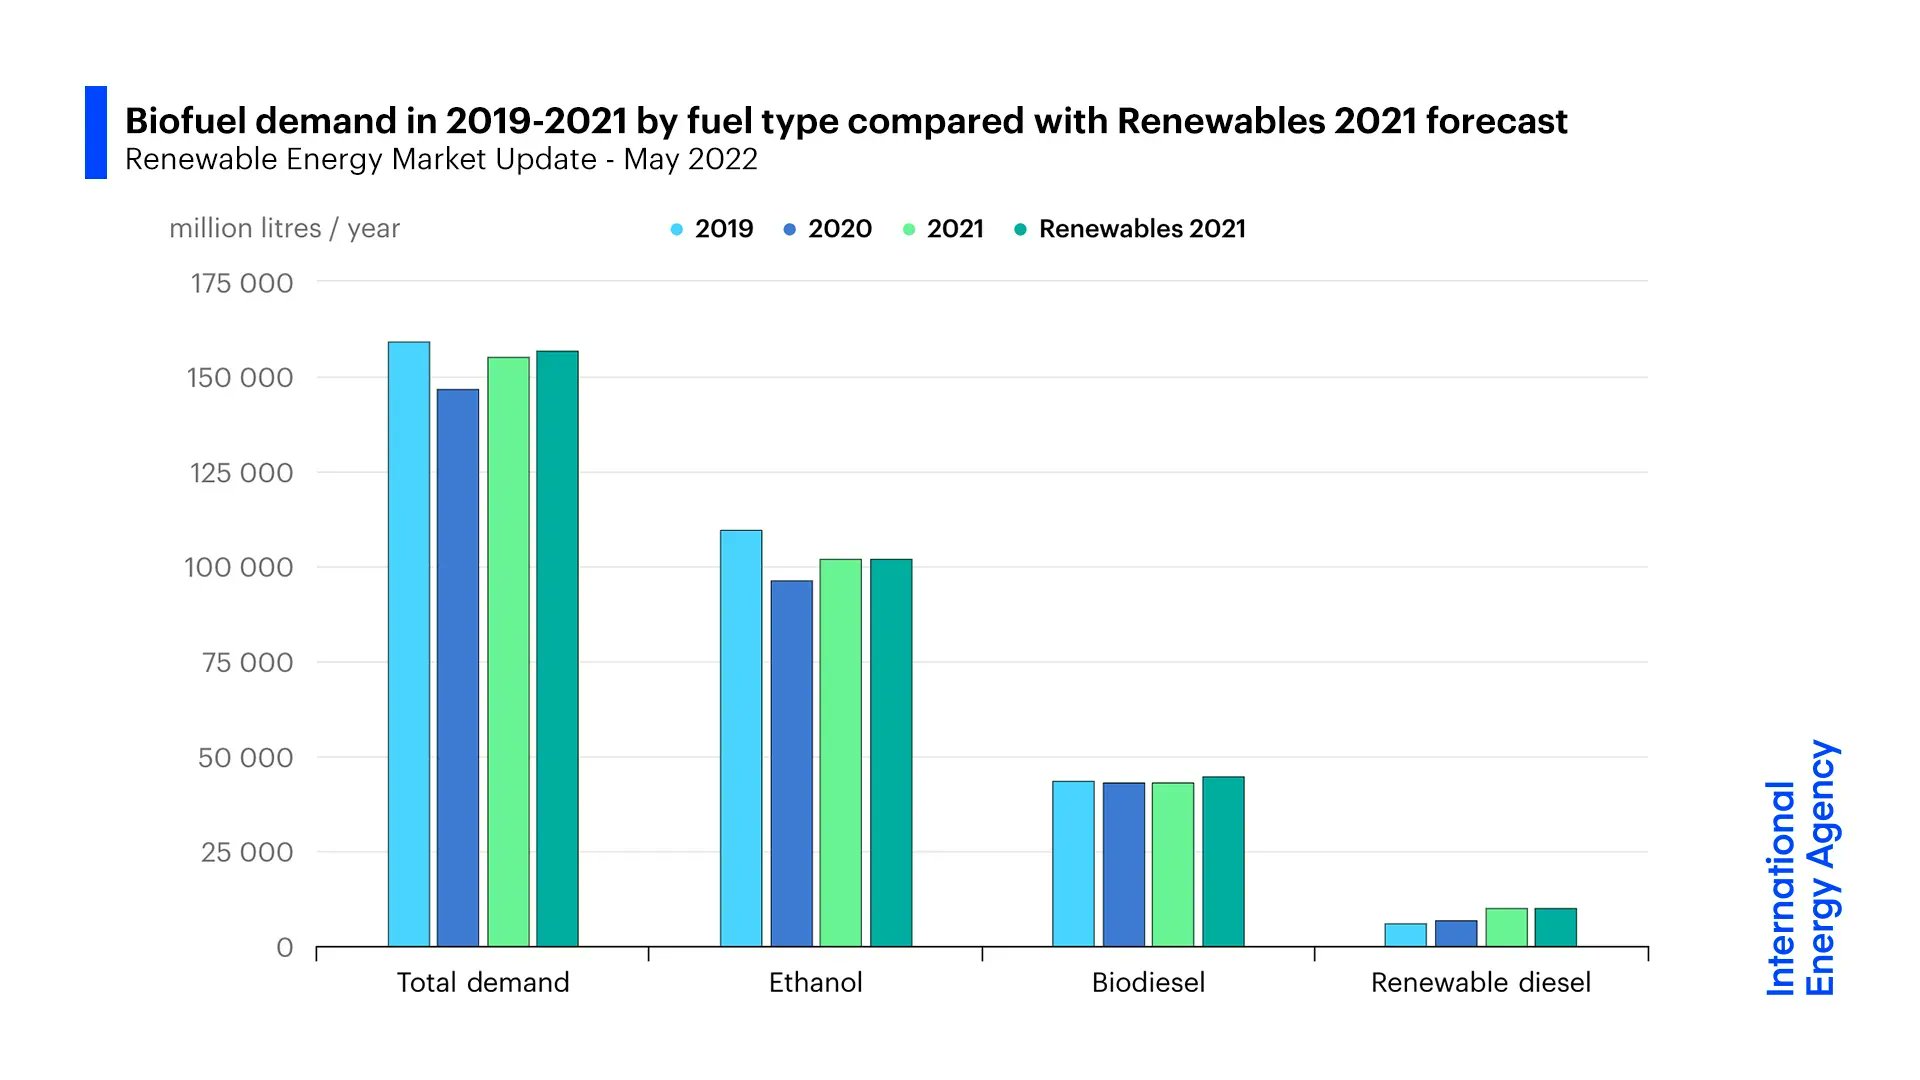
Biofuel demand in 2019-2021 by fuel type compared with Renewables 2021 forecast.jpg - EnergyAnalyst1

Drivers-of-forest-loss-in-the-Brazilean-Amazon.png - PJ Geest

Agriculture-value-added-per-worker-vs-gdp-per-capita (OWID 0016).png - Jason.nlw

Agriculture-decoupling-productivity (OWID 0021).png - Jason.nlw

Agricultural-land-area-by-farm-size (OWID 0029).png - Jason.nlw

Agri-yields-uk (OWID 0033).png - Jason.nlw

Average-farm-size-vs-gdp (OWID 0084).png - Jason.nlw

Area-per-tonne-oil (OWID 0088).png - Jason.nlw

Cereal-crop-yield-vs-fertilizer-application (OWID 0112).png - Jason.nlw

Change-of-cereal-yield-vs-land-used (OWID 0155).png - Jason.nlw

Cereal-yields-vs-tractor-inputs-in-agriculture (OWID 0169).png - Jason.nlw

Cereal-yields-uk (OWID 0170).png - Jason.nlw

Dietary-land-use-vs-gdp-per-capita (OWID 0286).png - Jason.nlw

Fertilizer-per-hectare (OWID 0445).png - Jason.nlw

Fertilizer-inputs-per-land (OWID 0450).png - Jason.nlw

Fertilizer-exports-russia-ukraine (OWID 0451).png - Jason.nlw

Fertilizer-consumption-per-hectare-vs-gdp-per-capita (OWID 0454).png - Jason.nlw

Land-use-vs-yield-change-in-cereal-production (OWID 0581).png - Jason.nlw

Land-sparing-by-crop (OWID 0593).png - Jason.nlw

Number-farms-size (OWID 0611).png - Jason.nlw

Nitrogen-output-vs-nitrogen-input-to-agriculture (OWID 0622).png - Jason.nlw

Number-of-people-employed-in-agriculture (OWID 0729).png - Jason.nlw

Per-capita-nitrous-oxide-agriculture (OWID 0747).png - Jason.nlw

Share-food-exports (OWID 0910).png - Jason.nlw

Share-farms-smallholders-vs-gdp (OWID 0912).png - Jason.nlw

Value-added-in-the-agricultural-sector-as-of-gdp-vs-gdp-per-capita (OWID 1129).png - Jason.nlw

Farmers as percentage of population.png - SamuelSThomas
Animal agriculture entrenchment in academia case study – analysis of known funding streams for the UC Davis CLEAR Center and Colorado State University AgNext at CSU.webp - Prototyperspective

Land animals slaughtered for meat - Our World in Data.png - Alenoach

Producer Support Estimate measured as a percentage of gross farm receipts.jpg - Synopsis19117

Inorganic fertilizer use by region.svg - DanSD19