Wikimedi'Òc
Modes d'emploi

Cet album fait partie des albums
Cet album photos contient les sous-albums suivants :


Verteilung der Weltbevölkerung nach Subsistenztätigkeit.png - Offbeat

Agriculture value added per worker vs. GDP per capita, OWID.svg - Fæ

Employment in agriculture vs GDP per capita, OWID.svg - Fæ

GDP per head vs share of agriculture in employment, OWID.svg - Fæ

Number of people employed in agriculture since 1800, OWID.svg - Fæ

Share of agriculture in GDP vs GDP per capita, OWID.svg - Fæ

Share of employed women working in agriculture vs. GDP per capita, OWID.svg - Fæ

Share of employment in agriculture, industry, and services, OWID.svg - Fæ

Cereal distribution to food, animal feed and other uses, OWID.svg - Fæ

Tea production by region, OWID.svg - Fæ

Agricultural export subsidies, OWID.svg - Fæ

Share of global fish stocks that are not overexploited, OWID.svg - Fæ

Greenhouse gas emissions from agriculture, OWID.svg - Fæ

Nitrous oxide emissions from agriculture, OWID.svg - Fæ

Composition of national gross domestic product by sector, OWID.svg - Fæ

Share of male vs female employment in agriculture, OWID.svg - Fæ

Cereal crop yield vs. fertilizer application, OWID.svg - Fæ
Global food miles by transport method, OWID.svg - Fæ
Share of global food miles by transport method, OWID.svg - Fæ

Agricultural area over the long-term, OWID.svg - Fæ

Agricultural area per capita, OWID.svg - Fæ

Agricultural land use per person, OWID.svg - Fæ

Agricultural yields in key crops per hectare since 1961, OWID.svg - Prototyperspective

Cereal yield vs. GDP per capita, OWID.svg - Fæ

Cereal yields vs. GDP per capita, OWID.svg - Fæ

Cereal yields vs. tractor inputs in agriculture, OWID.svg - Fæ

Cropland per capita, OWID.svg - Fæ

Cropland use over the long-term, OWID.svg - Fæ

Dietary land use vs. GDP per capita, OWID.svg - Fæ

FAO projections of arable land to 2050, OWID.svg - Fæ

Global agricultural land use by major crop type, OWID.svg - Fæ

Global land spared as a result of cereal yield improvements, OWID.svg - Fæ

Land use vs. yield change in cereal production, OWID.svg - Fæ

Projections for global peak agricultural land, OWID.svg - Fæ

The change of cereal yield vs. land used for cereal production, OWID.svg - Fæ

Cereal production, yield and land use, OWID.svg - Fæ

Dietary land use vs. beef consumption, OWID.svg - Fæ

Meat production by livestock type, OWID.svg - Fæ

Share of agriculture in GDP vs GDP per capita, 1, OWID.svg - Fæ

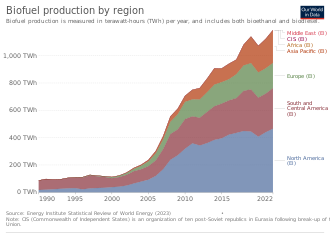
Biofuel production by region, OWID.svg - Fawxxer

Employment in agriculture vs. urban population, OWID.svg - Fæ

Agricultural water withdrawals vs. GDP per capita, OWID.svg - Fæ

Global freshwater use over the long-run, OWID.svg - Fæ

Global land use for food production, OWID statistic.png - PJ Geest

GHG from AFOLU.png - コイコイ
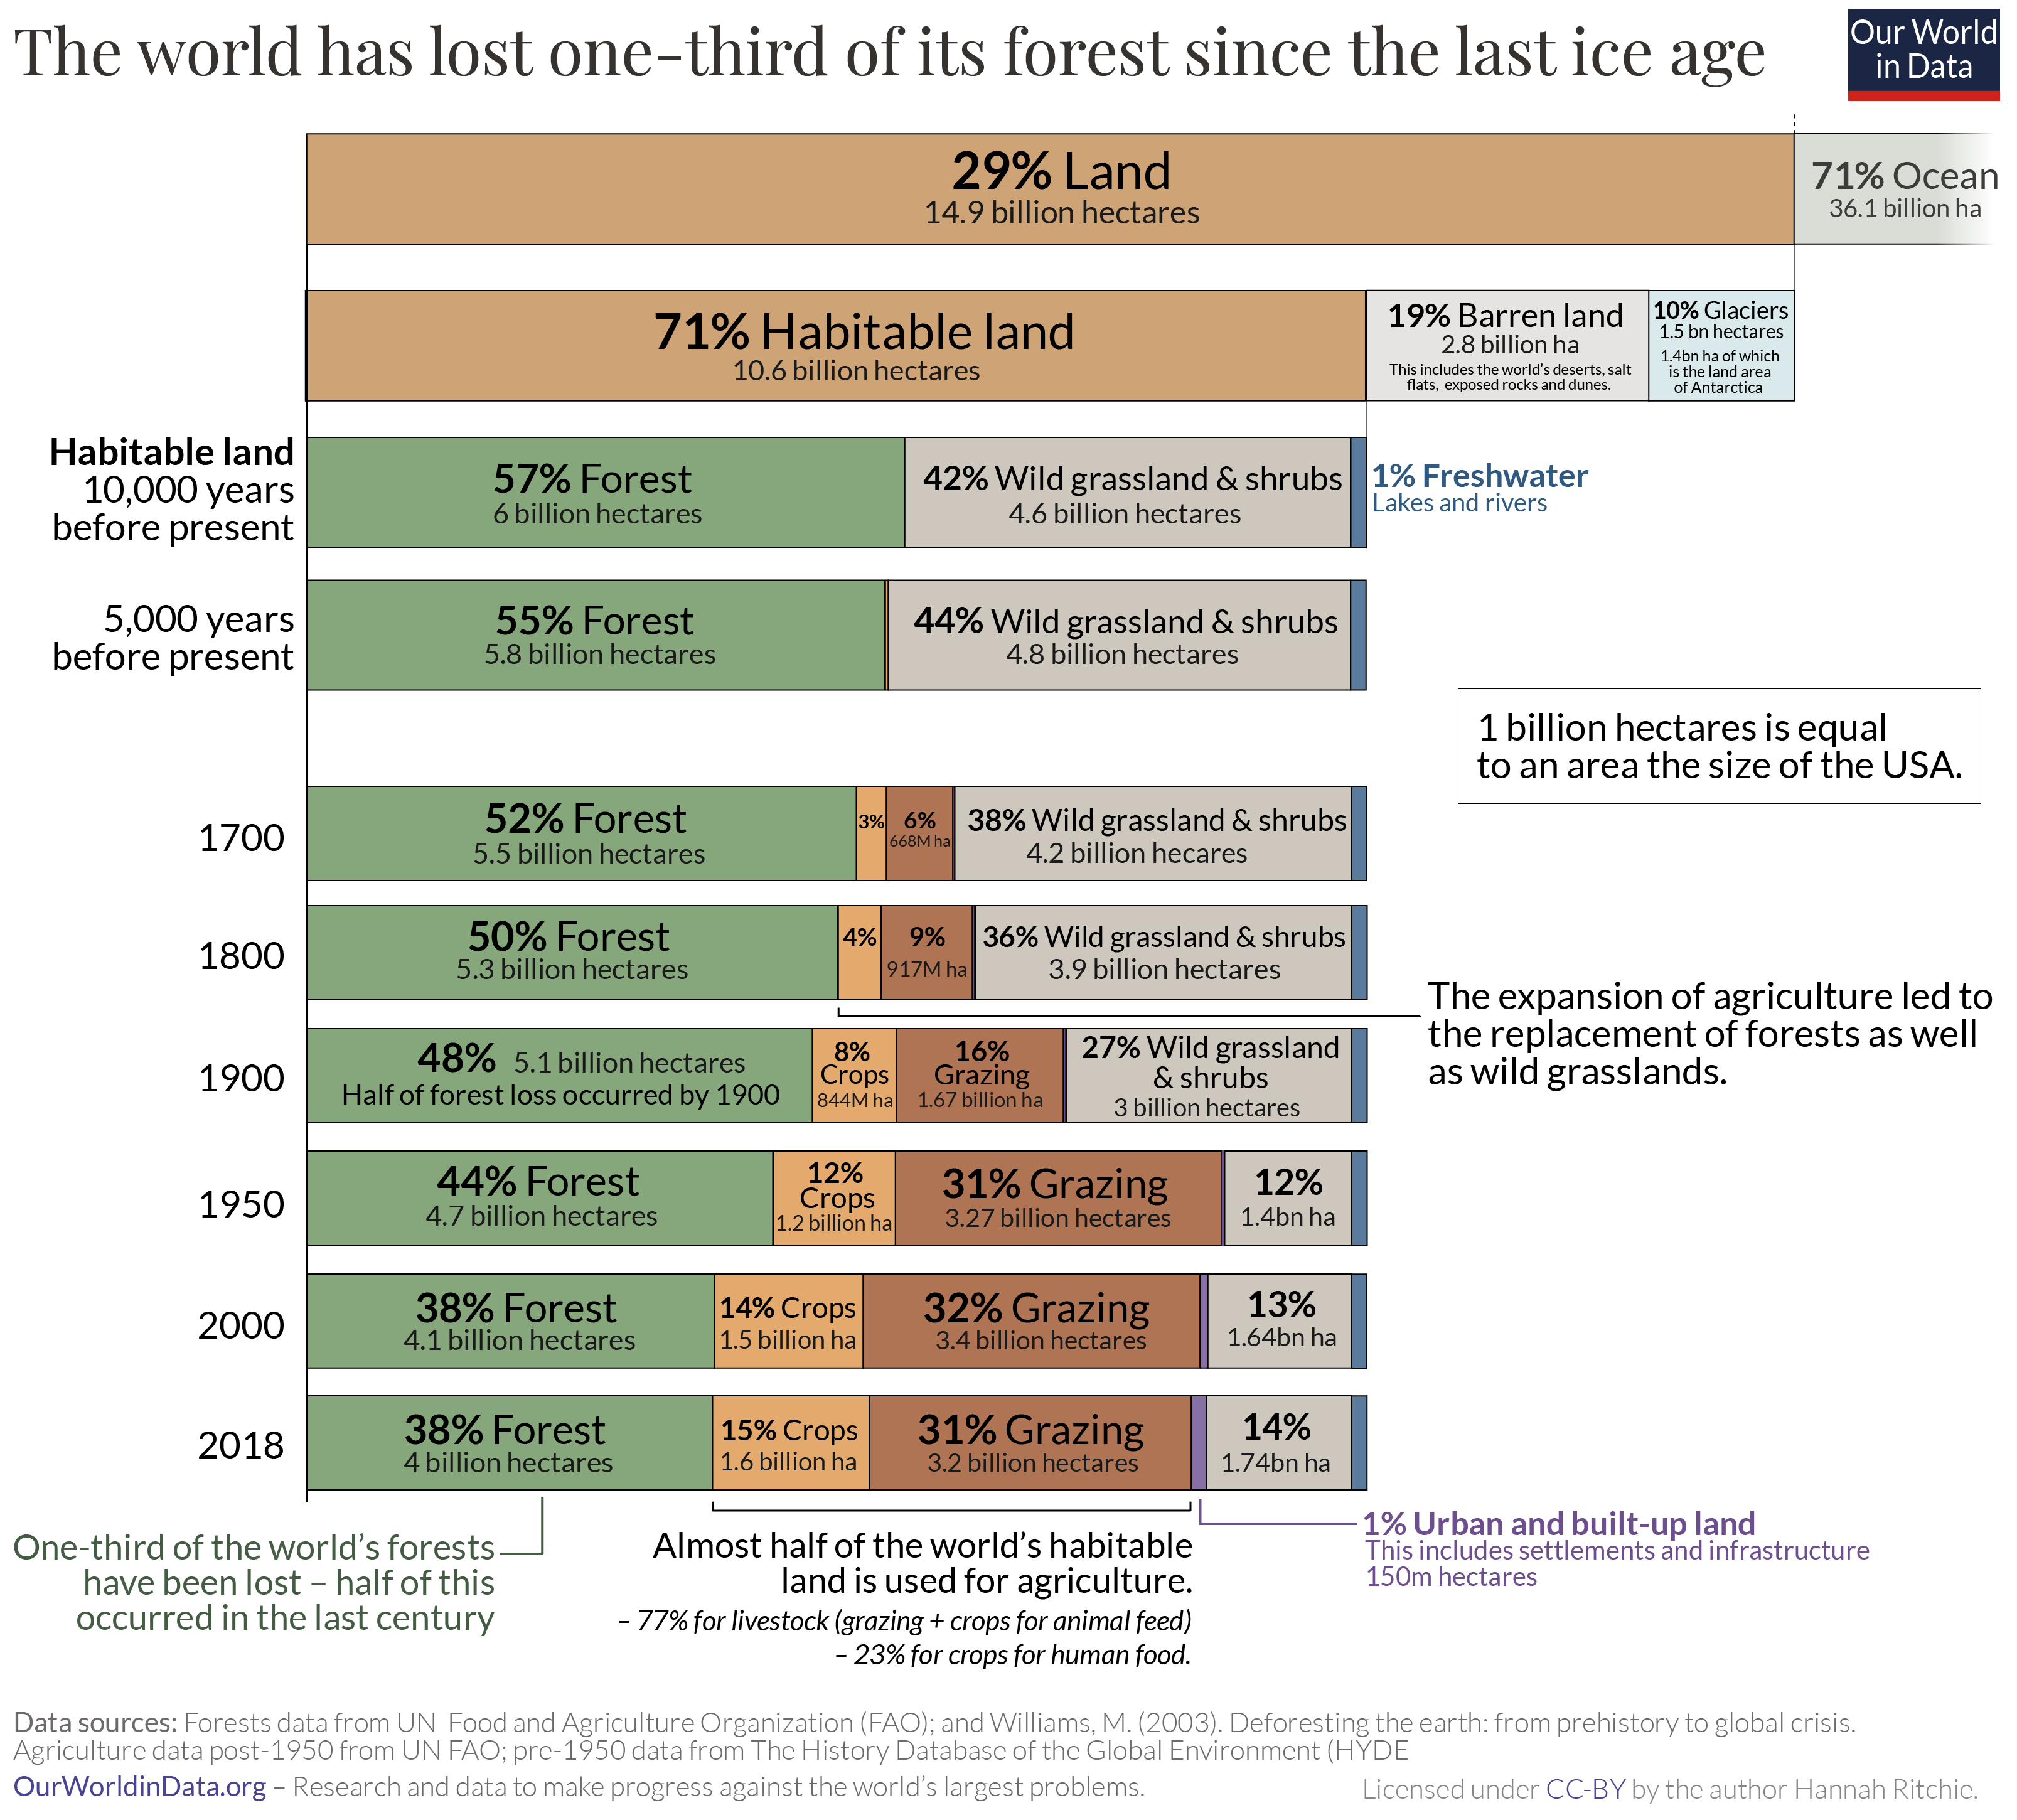
Long-term-change-in-land-use.png - PJ Geest
The State of Food and Agriculture 2021. Making agrifood systems more resilient to shocks and stresses, In brief.pdf - DanSD19

Évolution de la surface agricole à long terme, OWID.svg - D Cat laz

Cereals allocated to food, animal feed and fuel, World.png - Prototyperspective

Decline-of-the-worlds-wild-mammals.png - Vergänglichkeit

Overview of global calorie intake and sensitivity to livestock and food waste assumptions.webp - Prototyperspective

Global average human diet and protein composition and usage of crop-based products.webp - Prototyperspective
Calorie production changes for crops and fish, and accumulated carbon change for grasses following different nuclear war soot injections.webp - Prototyperspective
Climatic impacts by year after different nuclear war soot injections.webp - Prototyperspective

所得国別牛の頭数.png - コイコイ

Food-, land-, and climate change mitigation-gaps for 2050.jpg - Prototyperspective

Global greenhouse gas emissions from food production.png - Raquel Baranow

Estimated total annual greenhouse gas emissions from present-day food consumption for carbon dioxide (CO2), methane (CH4), and nitrous oxide (N2O) by country.webp - Prototyperspective

Estimated annual greenhouse gas emissions per capita from present-day food consumption for carbon dioxide (CO2), methane (CH4), and nitrous oxide (N2O) by country.webp - Prototyperspective

Agriculture-share-gdp (OWID 0017).png - Jason.nlw

Agriculture-more-less-land (OWID 0019).png - Jason.nlw

Agriculture-land-fao (OWID 0020).png - Jason.nlw

Agricultural-output-dollars (OWID 0026).png - Jason.nlw

Average-farm-size (OWID 0085).png - Jason.nlw

Cereal-production (OWID 0111).png - Jason.nlw

Change-calories-climate-yield (OWID 0166).png - Jason.nlw
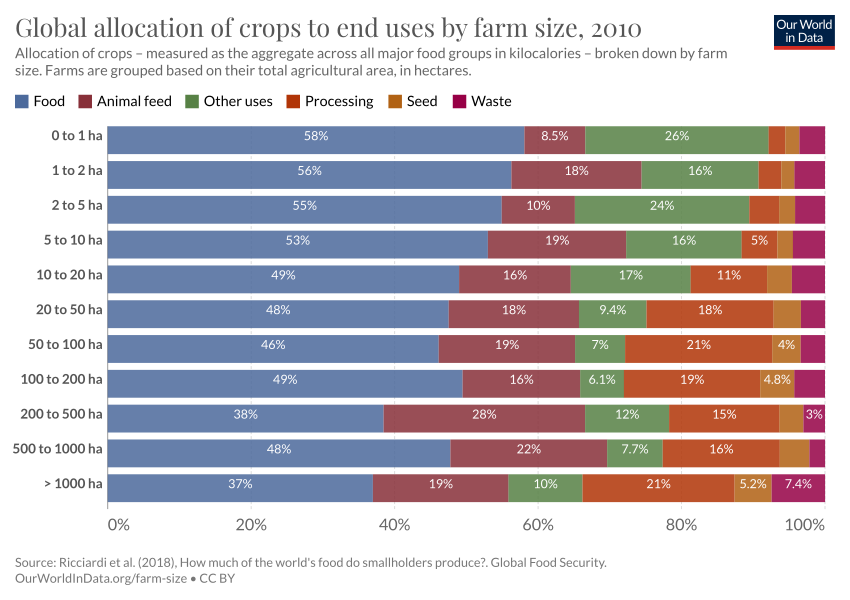
Crop-allocation-farm-size (OWID 0229).png - Jason.nlw

Extent-of-intensive-agriculture (OWID 0331).png - Jason.nlw

Excess-nitrogen (OWID 0343).png - Jason.nlw

Fertilizer-use-nutrient (OWID 0443).png - Jason.nlw

Fertilizer-production-by-nutrient-type-npk (OWID 0446).png - Jason.nlw

Fertilizer-per-capita (OWID 0447).png - Jason.nlw

Fertilizer-consumption-usda (OWID 0449).png - Jason.nlw

Farm-size-change (OWID 0452).png - Jason.nlw

Global-crop-production-by-farm-size (OWID 0462).png - Jason.nlw

Global-agri-productivity-growth (OWID 0473).png - Jason.nlw

Index-of-cereal-production-yield-and-land-use (OWID 0493).png - Jason.nlw

Impact-climate-maize-percentage (OWID 0499).png - Jason.nlw

Habitat-loss-25-species (OWID 0517).png - Jason.nlw

Groundnuts-yield (OWID 0519).png - Jason.nlw

Global-pasture (OWID 0535).png - Jason.nlw
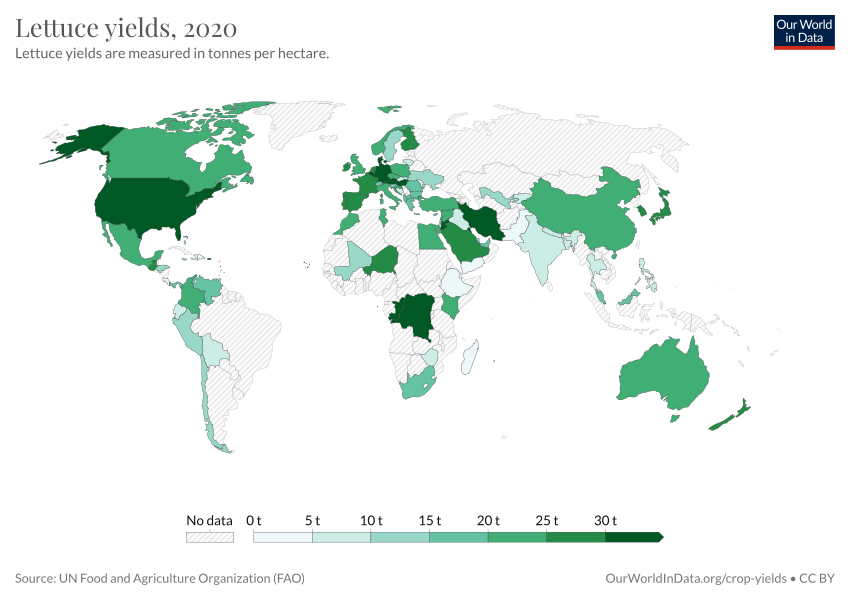
Lettuce-yields (OWID 0574).png - Jason.nlw

Land-use-for-vegetable-oil-crops (OWID 0588).png - Jason.nlw

Land-use-agriculture-longterm (OWID 0589).png - Jason.nlw

Key-crop-yields (OWID 0596).png - Jason.nlw

Nitrous-oxide-agriculture (OWID 0620).png - Jason.nlw

Nitrogen-inputs-per-hectare (OWID 0624).png - Jason.nlw

Pea-yields (OWID 0673).png - Jason.nlw

Palm-oil-yields (OWID 0680).png - Jason.nlw

Palm-oil-production (OWID 0682).png - Jason.nlw

Oil-yield-by-crop (OWID 0699).png - Jason.nlw

Onset-year-intensive-agriculture (OWID 0700).png - Jason.nlw

Number-of-farms (OWID 0733).png - Jason.nlw
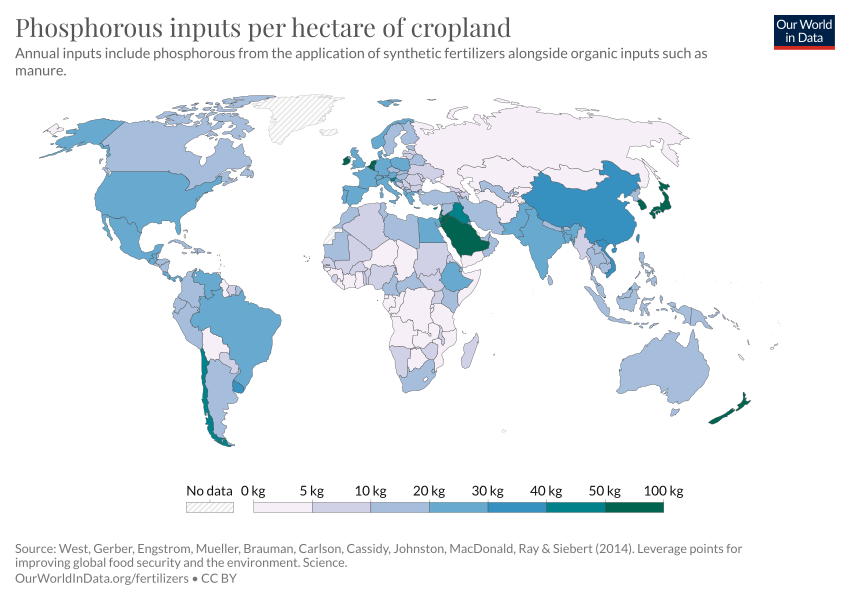
Phosphorous-inputs-per-hectare (OWID 0850).png - Jason.nlw

Regulation-illegal-fishing (OWID 0869).png - Jason.nlw

Share-farms-smallholders (OWID 0909).png - Jason.nlw

Share-food-lost-type (OWID 0911).png - Jason.nlw

Share-cereals-animal-feed (OWID 0943).png - Jason.nlw

Share-agriculture-smallholder-farms (OWID 0947).png - Jason.nlw

Sesame-seed-production (OWID 0951).png - Jason.nlw

Rye-yield (OWID 0959).png - Jason.nlw

Rye-production (OWID 0961).png - Jason.nlw

Soil-lifespans (OWID 0970).png - Jason.nlw

Share-global-excess-phosphorous (OWID 1014).png - Jason.nlw

Share-global-excess-nitrogen (OWID 1015).png - Jason.nlw

Total-nitrogen-inputs-crops (OWID 1032).png - Jason.nlw

Total-applied-phosphorous-crops (OWID 1035).png - Jason.nlw

Total-agricultural-land-use-per-person (OWID 1037).png - Jason.nlw

Tomato-production (OWID 1042).png - Jason.nlw

Sweet-potato-production (OWID 1058).png - Jason.nlw

Sunflower-seed-yield (OWID 1062).png - Jason.nlw

Sunflower-seed-production (OWID 1067).png - Jason.nlw

Soybean-production (OWID 1078).png - Jason.nlw

Soybean-production-and-use (OWID 1079).png - Jason.nlw

Soy-production-yield-area (OWID 1080).png - Jason.nlw

Sorghum-yield (OWID 1083).png - Jason.nlw

Change-in-production-yield-and-land-palm (OWID 0156).png - Jason.nlw

Cropland-pasture-per-person (OWID 0232).png - Jason.nlw

Employed-fisheries-aquaculture (OWID 0368).png - Jason.nlw

Employed-fisheries-aquaculture-time (OWID 0369).png - Jason.nlw

Rice production and consumption in Spain, UE and worldwide (1961-2003).jpg - Aleator

8000 BCE+ Loss of forest and grassland to grazing and crops.svg - RCraig09

Arable land needed to produce a fixed quantity of crops (1961 = 1), OWID.svg - Fæ

Arable land use per person, OWID.svg - Fæ

Arable-land-pin (OWID 0090).png - Jason.nlw

Barley production and consumption in Spain, UE and worldwide (1961-2003).JPG - Aleator