Wikimedi'Òc
Modes d'emploi

Cet album fait partie des albums
Cet album photos contient les sous-albums suivants :


OMXS30 index 1986-2024.png - Wkpd0123

OMXS30 index 1986-2024 log scale.png - Wkpd0123

OMXN40 index 2002-2024.png - Wkpd0123
NASDAQ IXIC - dot-com bubble small.png - Ed g2s

Austrian stock market index.jpg - Thalion77~commonswiki

Aktienindex1840ff.PNG - Machahn

ASX200.png - Popo le Chien

PSI-20 performance.png - Cmdrjameson

SandP 500 Historical Graph.svg - Lalala666~commonswiki

IE Real SandP Prices, Earnings, and Dividends 1871-2006.png - Cmdrjameson

OMXI15.jpg - Thalion77~commonswiki

Kospi.png - Rhythm

Wilshire 5000 historical graph.svg - File Upload Bot (Magnus Manske)

Micex.png - Almeewar

OMXI15 index 2009-2024.png - Wkpd0123

TEPIX.PNG - SSZ

Ibovespa.png - Rbaliq

MICEX Index graph.png - Hellerick

OMX Iceland 15 SEP-OCT 2008.png - File Upload Bot (Magnus Manske)

BIRS Index Performance Graph (May 04-Sep 06).jpg - File Upload Bot (Magnus Manske)

OMXIPI index 2002-2024 log scale.png - Wkpd0123

Aktienindex Merval 01 01 1998 bis 05 10 2004.png - Upload Bot (Rich Smith)

Athex Composite Share Price Index.png - Jashuah

EURO STOXX 50.png - Jashuah
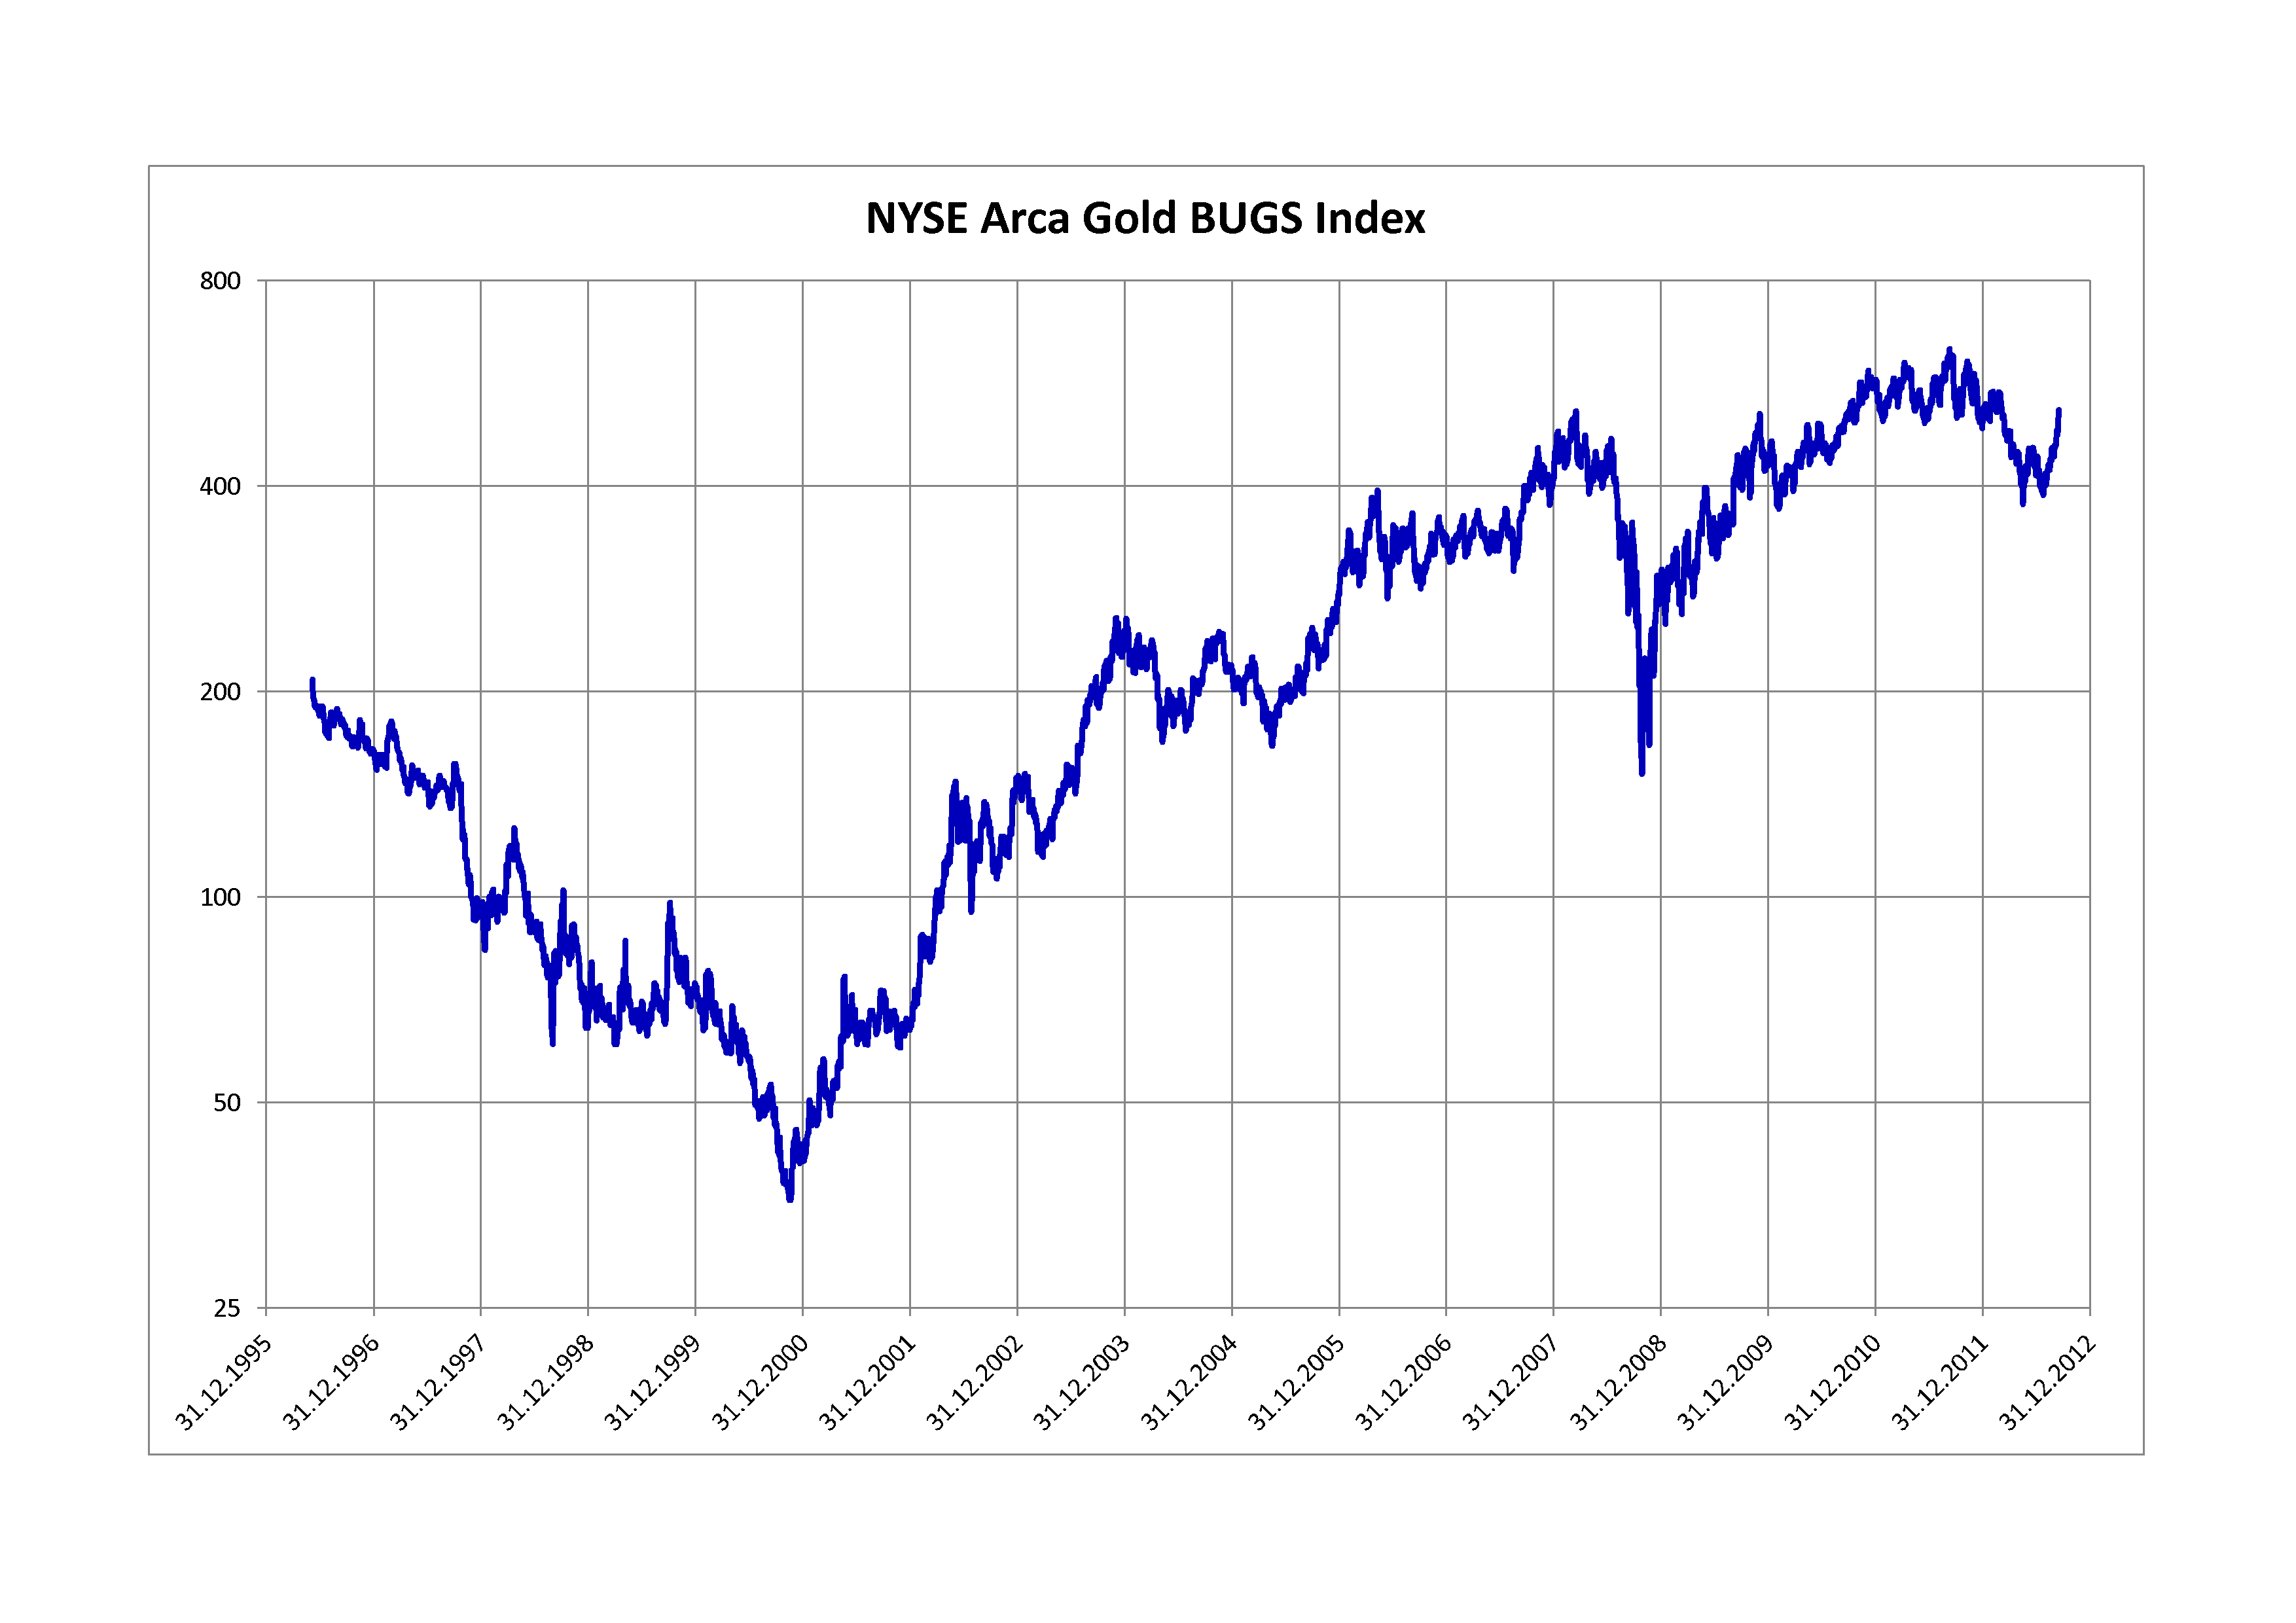
NYSE Arca Gold BUGS Index.png - Jashuah
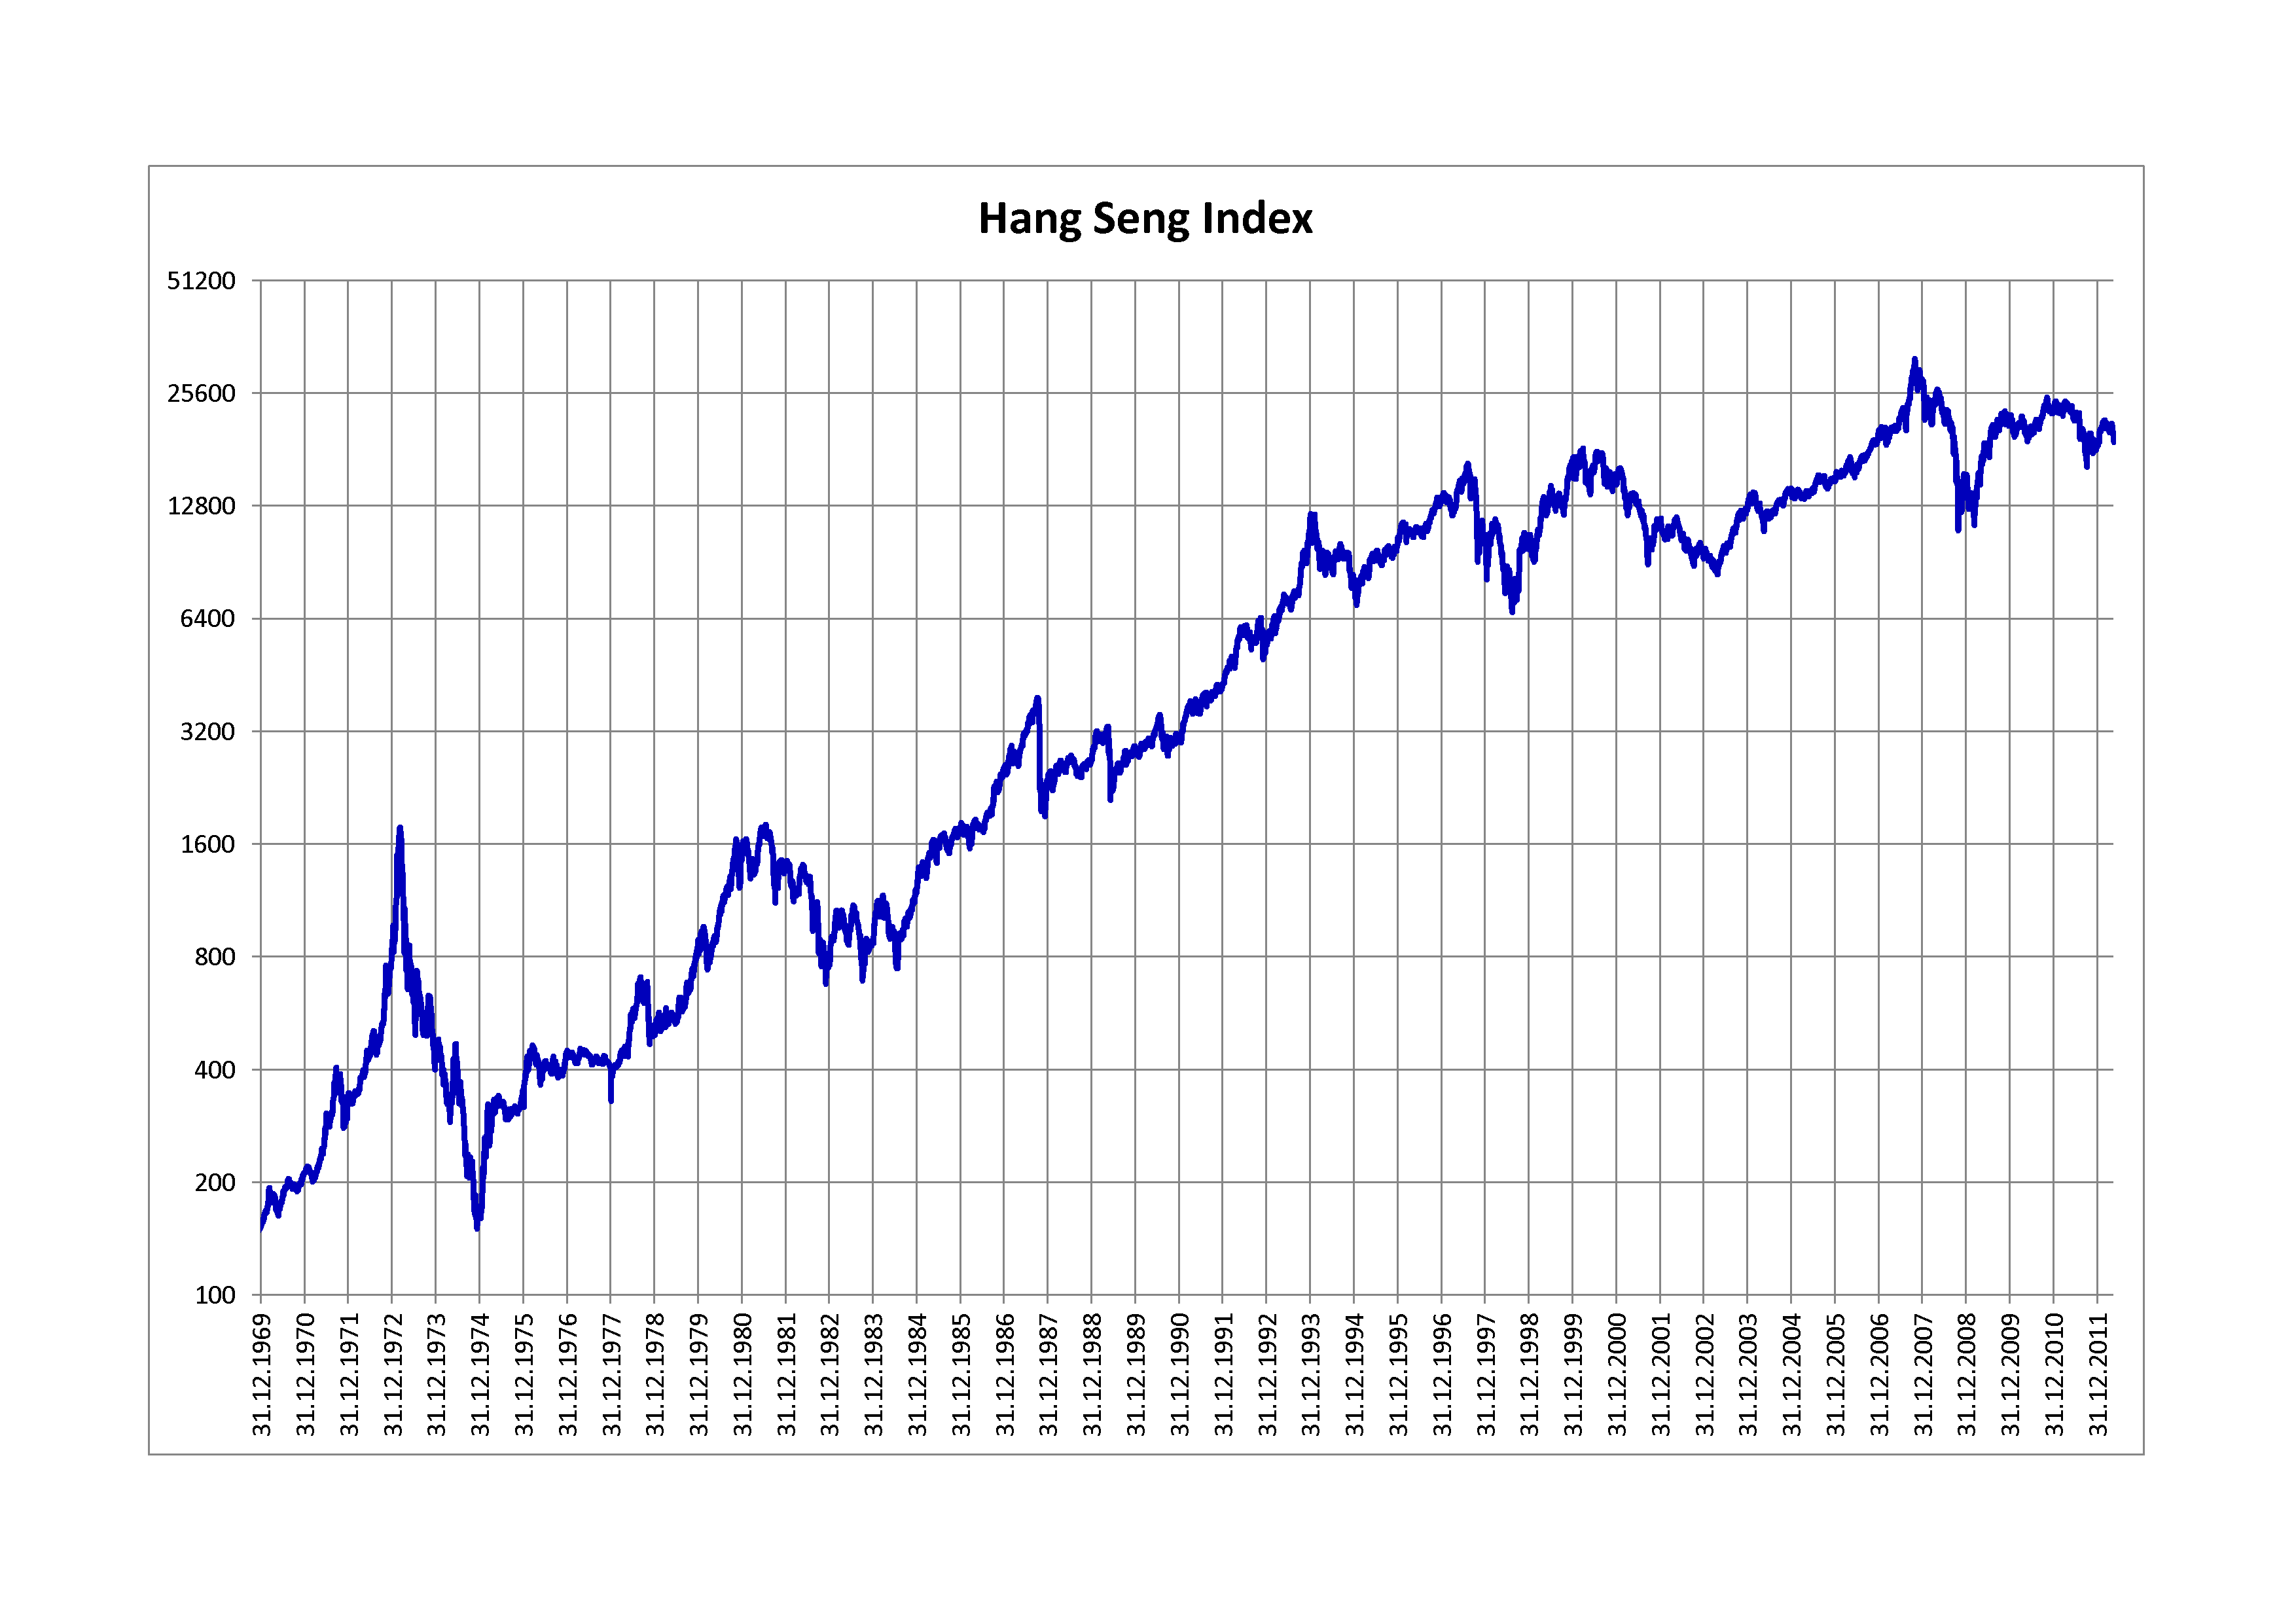
Hang Seng Index.png - Jashuah

FTSE MIB.png - Jashuah
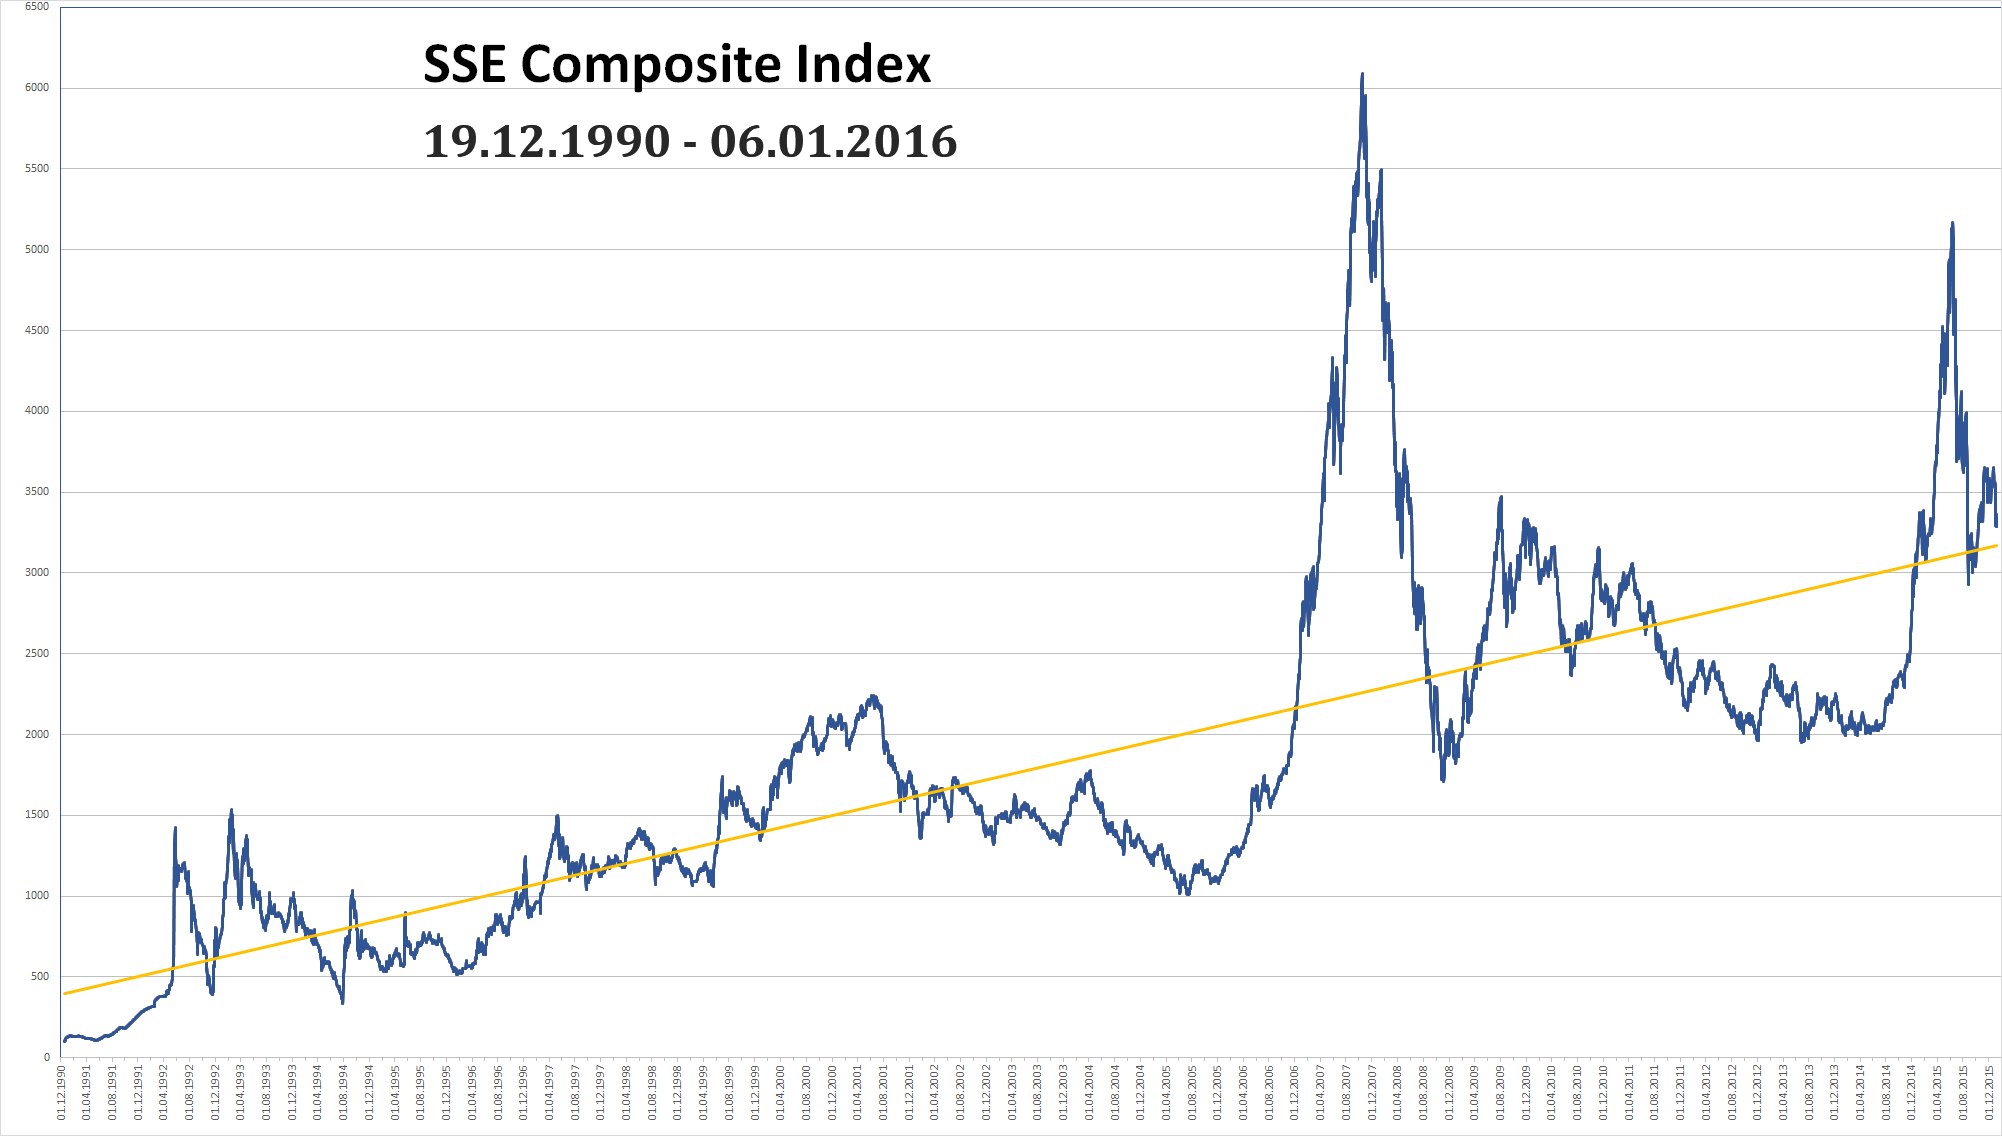
SSE Composite Index.png - Cmdrjameson
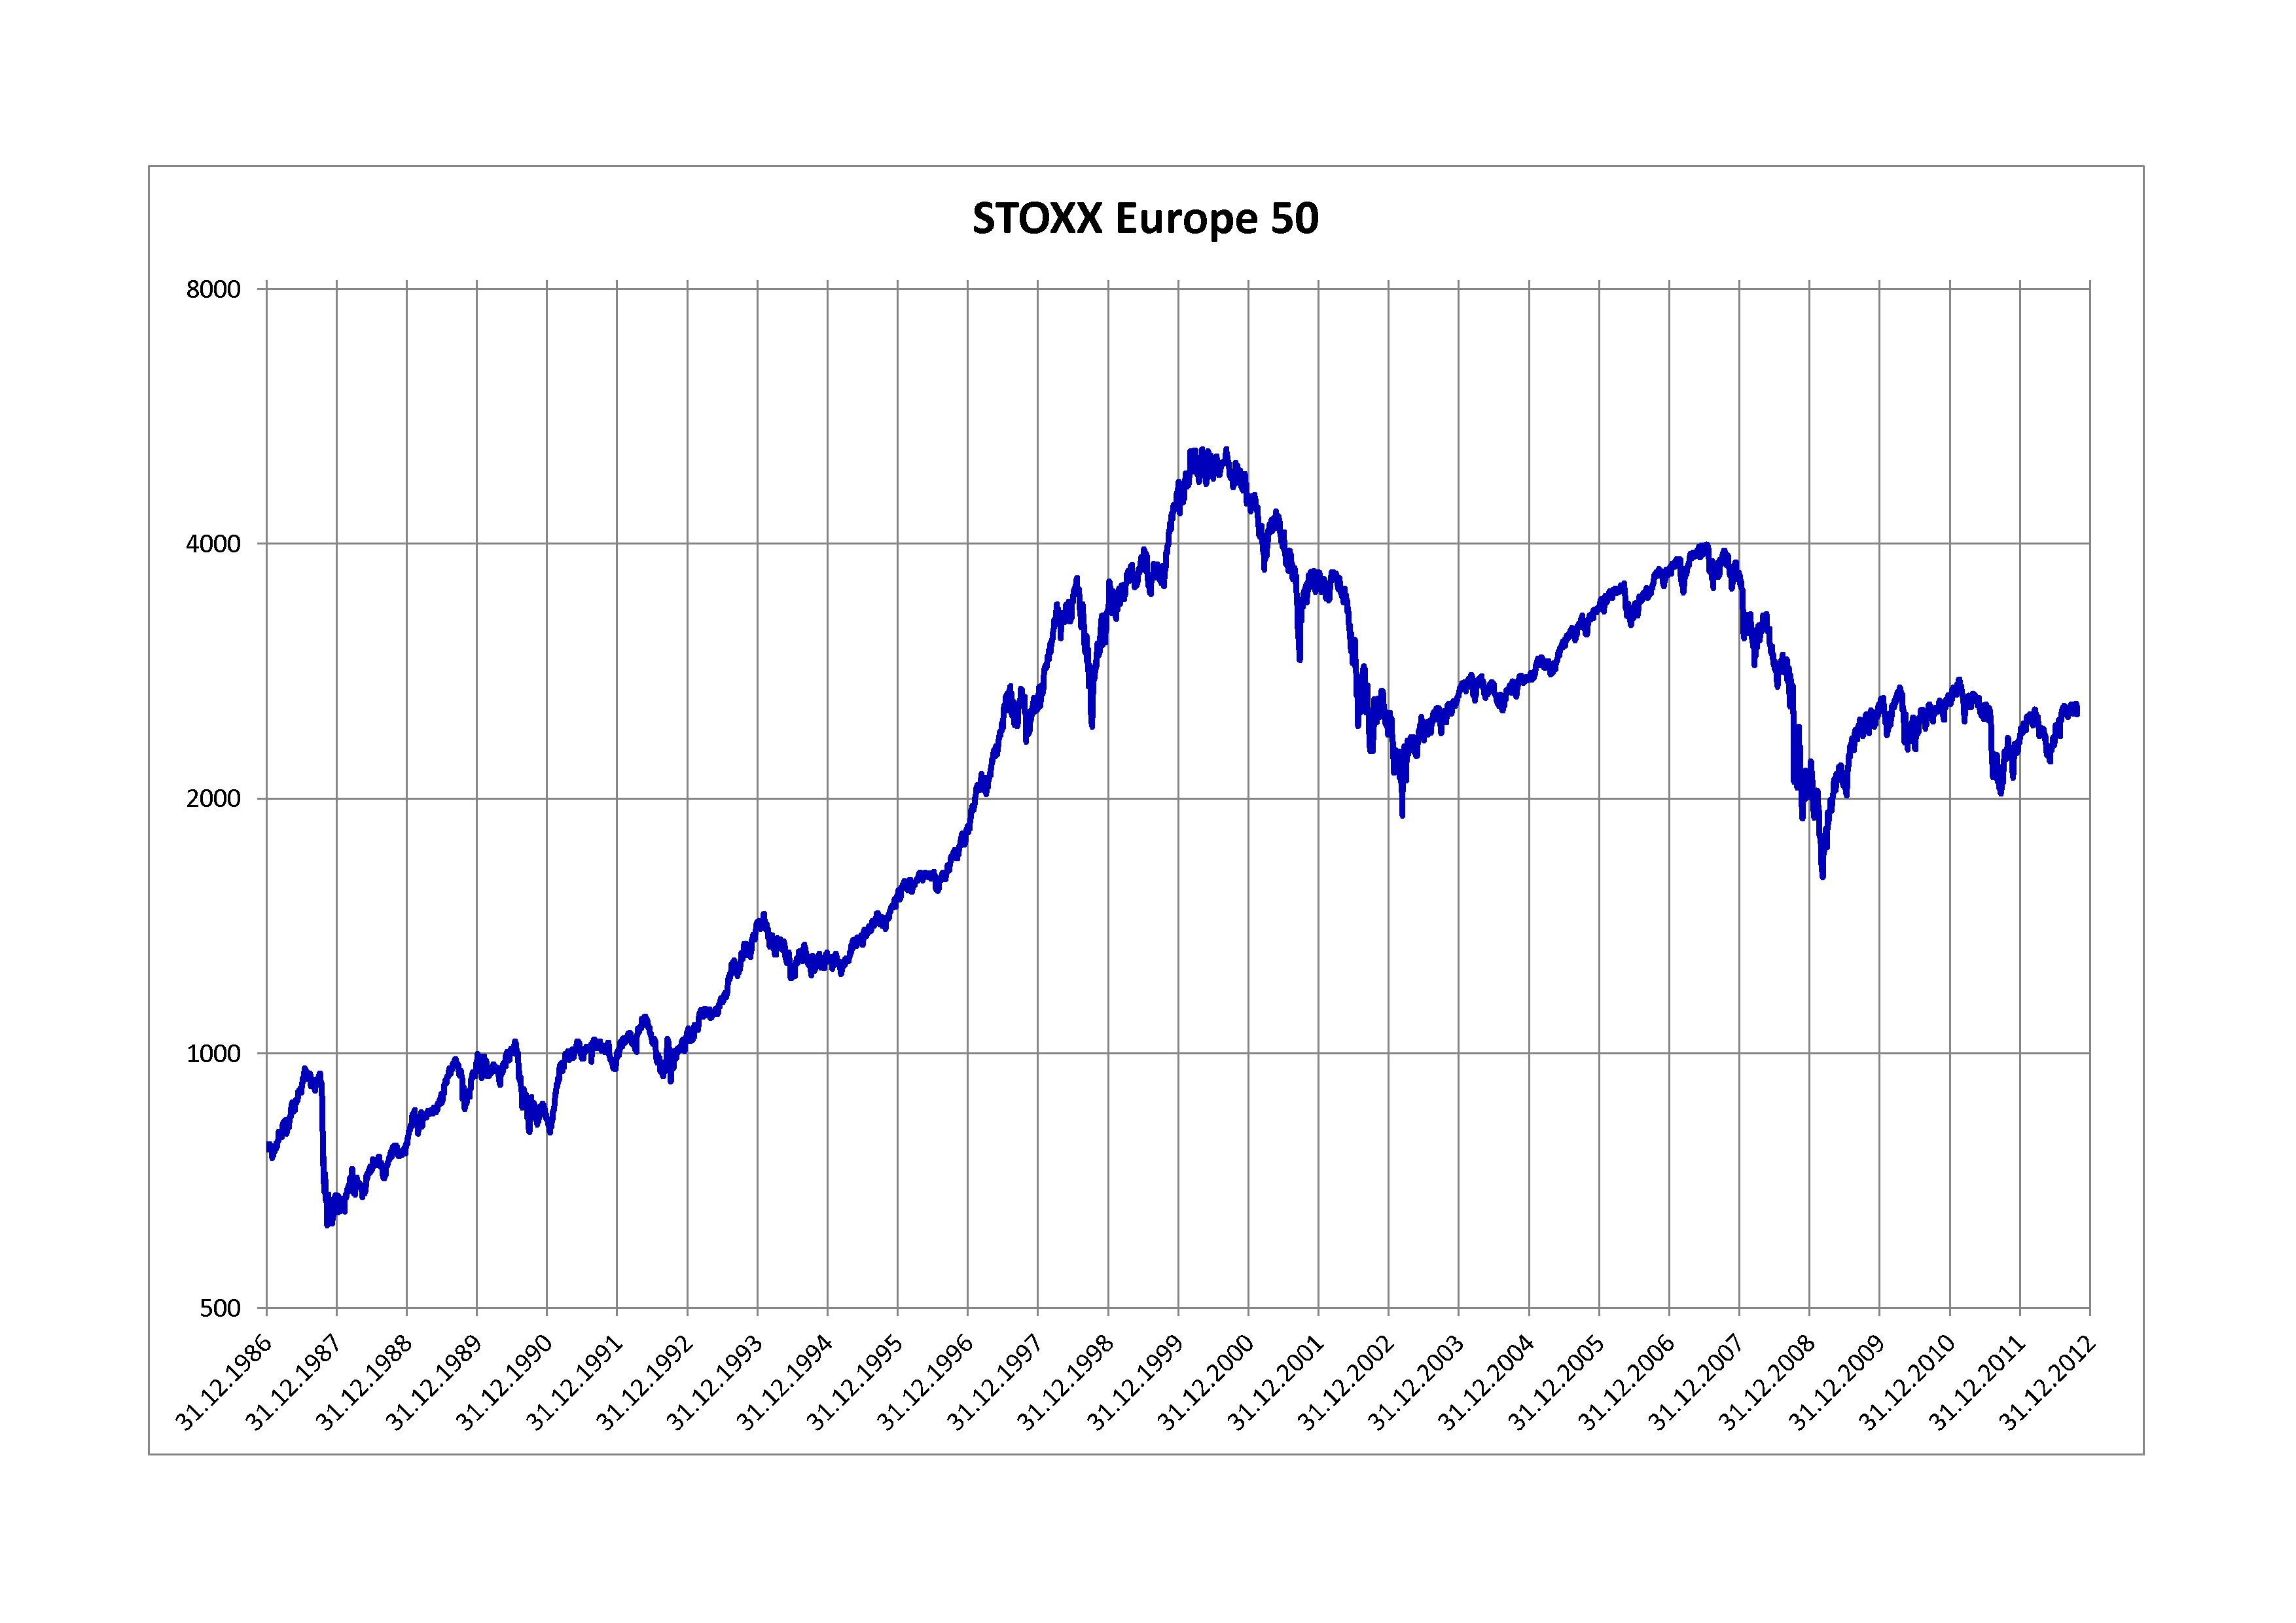
STOXX Europe 50.png - Jashuah
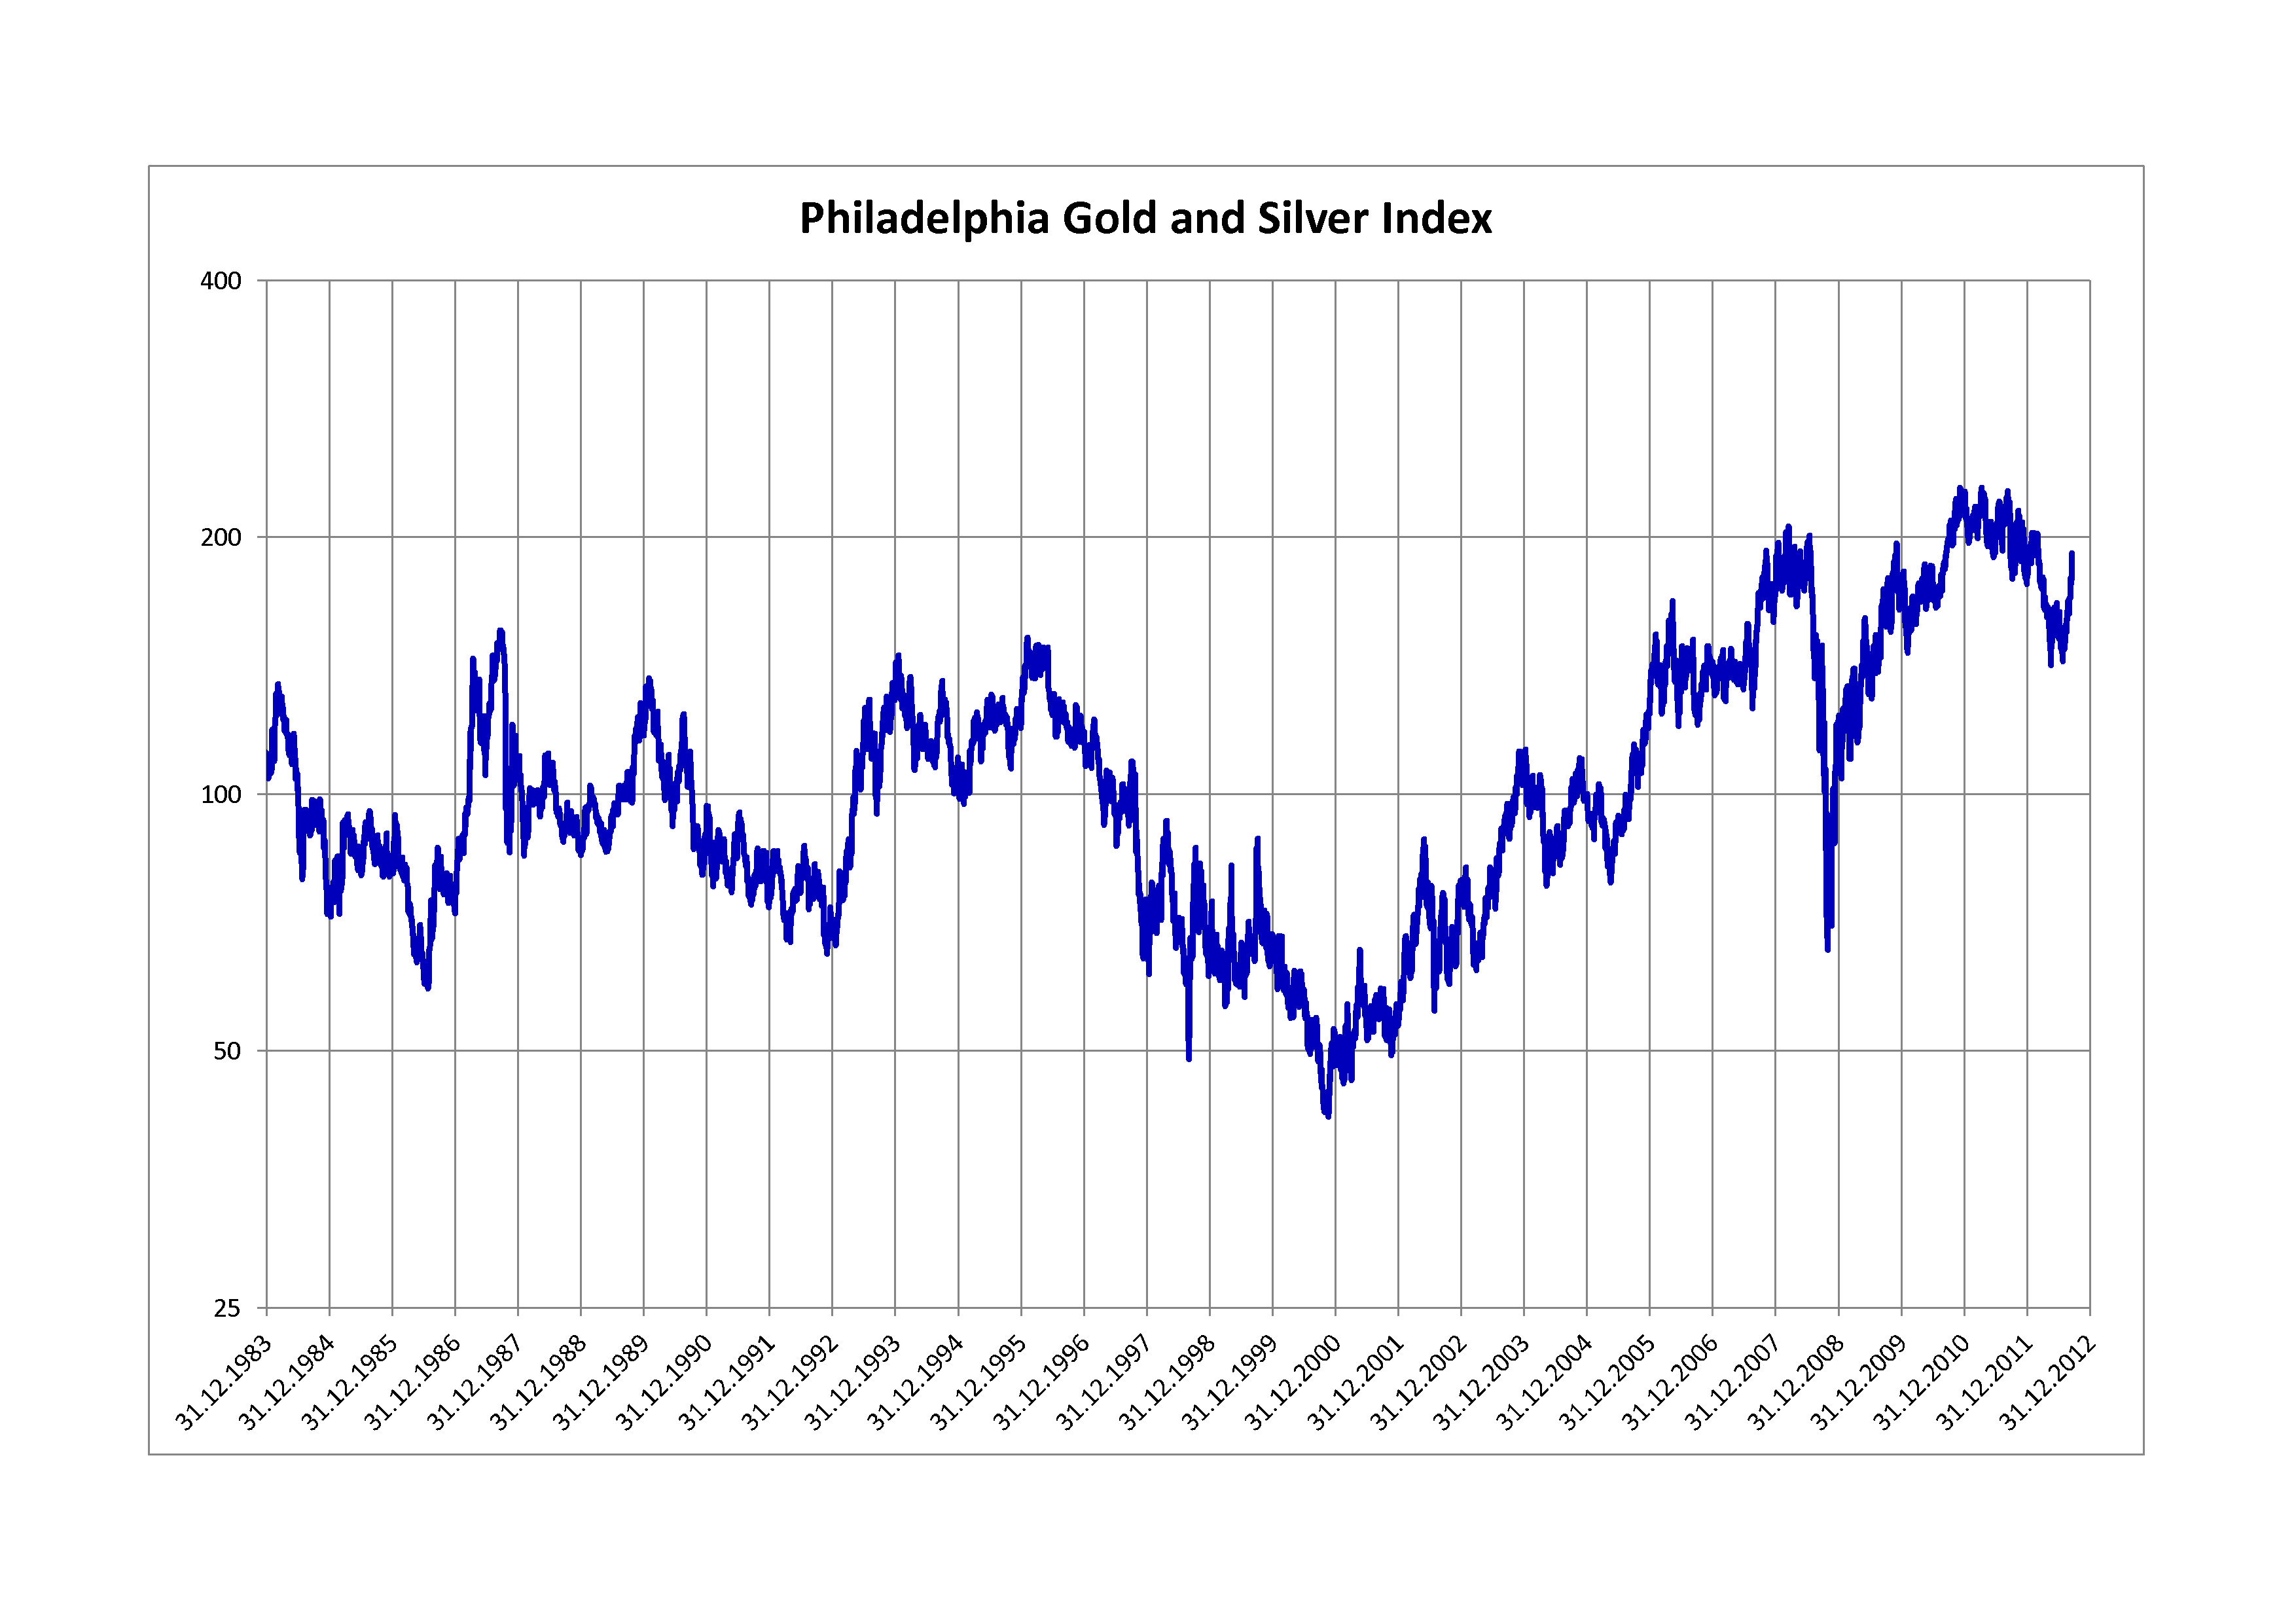
Philadelphia Gold and Silver Index.png - Jashuah

KOSPI.png - Jashuah
Dow Jones Transportation Average.png - Jashuah

Russell 2000.png - Jashuah
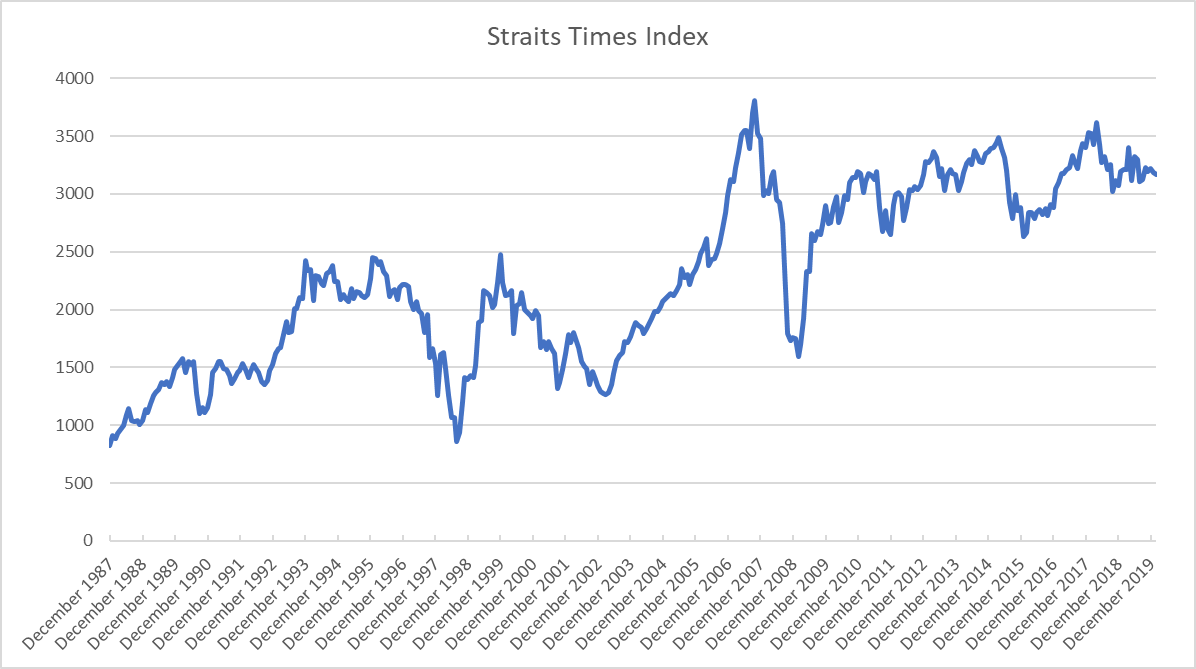
Straits Times Index.png - Robertsky

Aktienindex des Statistischen Reichsamtes in Goldmark.png - Jashuah

Aktienindex des Statistischen Reichsamtes in Papiermark.png - Jashuah

Aktienindex des Statistischen Reichsamtes in Reichsmark.png - Jashuah

NASDAQ-100.png - Jashuah

PSI 20.png - Jashuah

All Ordinaries.png - Jashuah

OMX Stockholm 30.png - Jashuah

ISEQ Overall Index.png - Jashuah
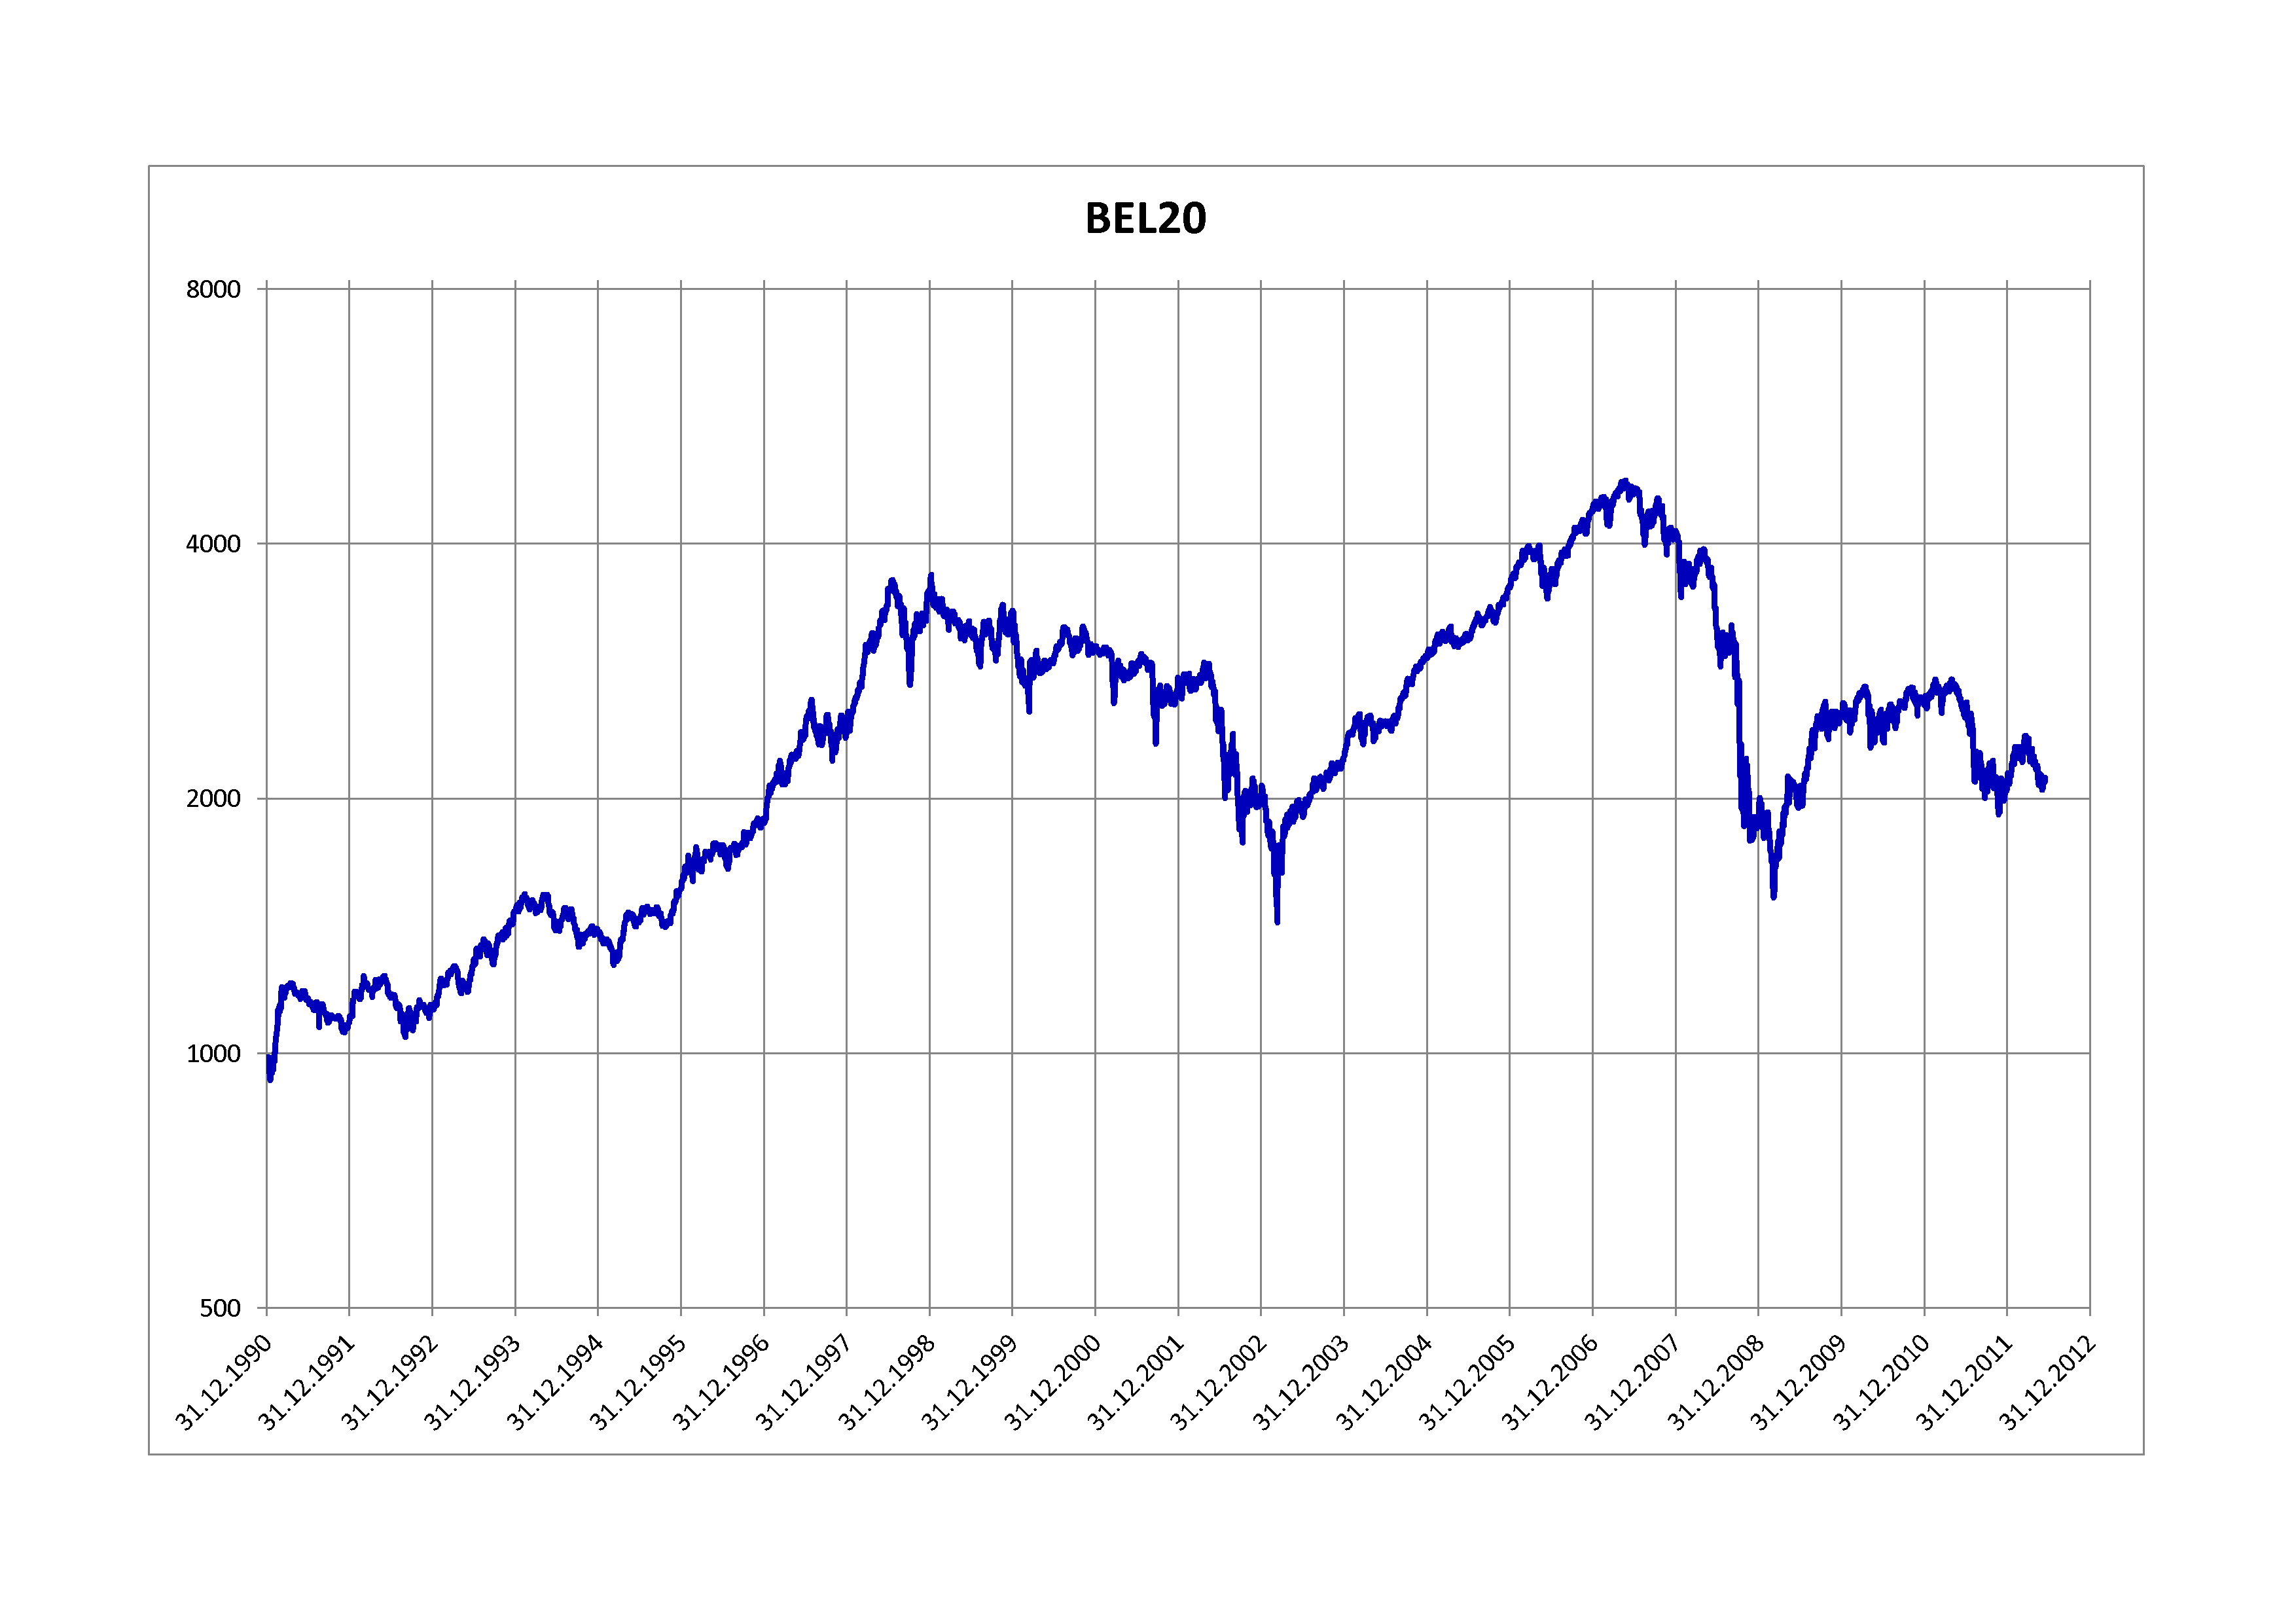
BEL20.png - Jashuah

WIG20.png - Jashuah

S&P TSX Composite Index.png - Jashuah

MERVAL.png - Jashuah

ISE-100 Index.png - Jashuah

SET Index.png - Jashuah

Wilshire 5000 historical.png - BMBender

Dow Jones Utility Average.png - Jashuah

Austrian Traded Index.png - Renerpho

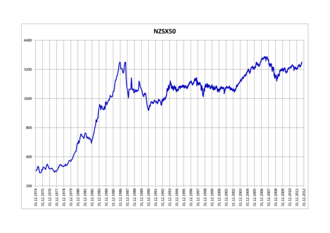
NZSX50.png - Jashuah

OMX Copenhagen 20.png - Jashuah

OBX Index.png - Jashuah

OMX Helsinki 25.png - Jashuah

IDX Composite.png - Jashuah

TEPIX (Cro).PNG - Orijentolog

S&P500 (1950-12).jpg - Mogrifier5

S&P BSE SENSEX chart.svg - Aaditya 7
Mbi.jpg - Bkom2014
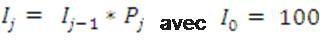
Légende du calcul.jpg - Bkom2014

AscX-Index.png - GifTagger

BCPP 2007 2008.png - GifTagger

Comparison of three stock indices after 1975.svg - Fern 24

Tadawul All Share Index (TASI) Since 1.png - Cmdrjameson

Euro Münzgeld und Portmonee mit grünem Pfeil (Geld, Kleingeld, Münzen).jpg - Chs87

Euro Münzgeld und Portmonee mit rotem Pfeil - Radial - (Geld, Kleingeld, Münzen).jpg - Chs87

Euro Münzgeld und Portmonee mit rotem Pfeil (Geld, Kleingeld, Münzen).jpg - Chs87

FTSE 100 index chart since 1984.png - OgreBot

Ukrainian PFTS Stock index 2001-2016.png - Cmdrjameson

IE Real SandP Prices, Earnings, and Dividends 1871-2006 - PT.png - Ederporto

Kospi-index-monthly (1993-2017).png - 밥풀떼기

ISE-100 Index.svg - Sigbert

HK 上環 Sheung Wan 德輔道中 Des Voeux Road Central shop Sun Hung Kei Financial display sign Hang Seng Stock Index October 2017 IX1.jpg - EILModgeea

Historische Indexgewichtung im WIG30.png - M-hue

MOEX Russia Index.png - Underlying lk
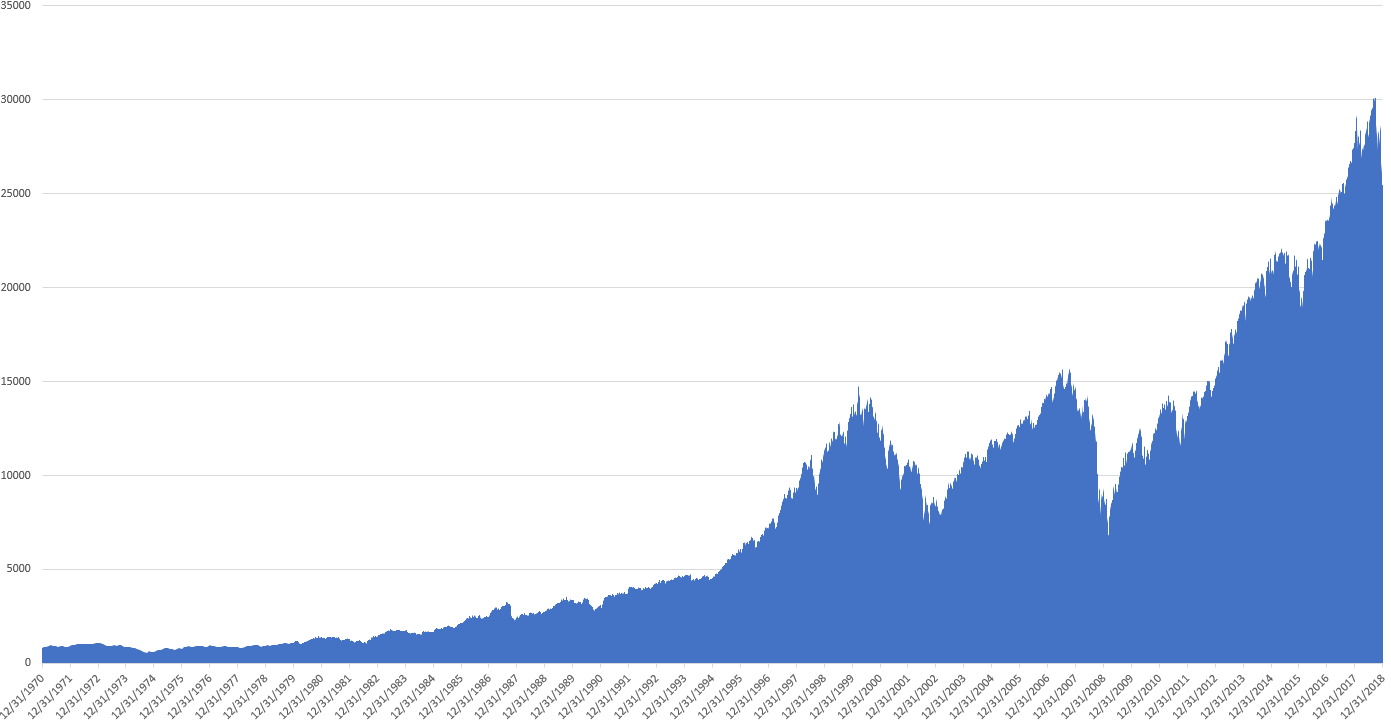
Wilshire 5000 price index 31 Dec 1970 - 03 Jan 2019.png - Hp15t

10-Year Price Trend of Dow Jones Global Titans 50 Index (USD).svg - KennethSweezy

BEL20 index.png - Jona

BEL 20.svg - Jona

STOXX Europe 600.png - Wakuwaku99

MSCI EM (2020).svg - MB-one

Trading apps on an iPhone screen.jpg - Forextime
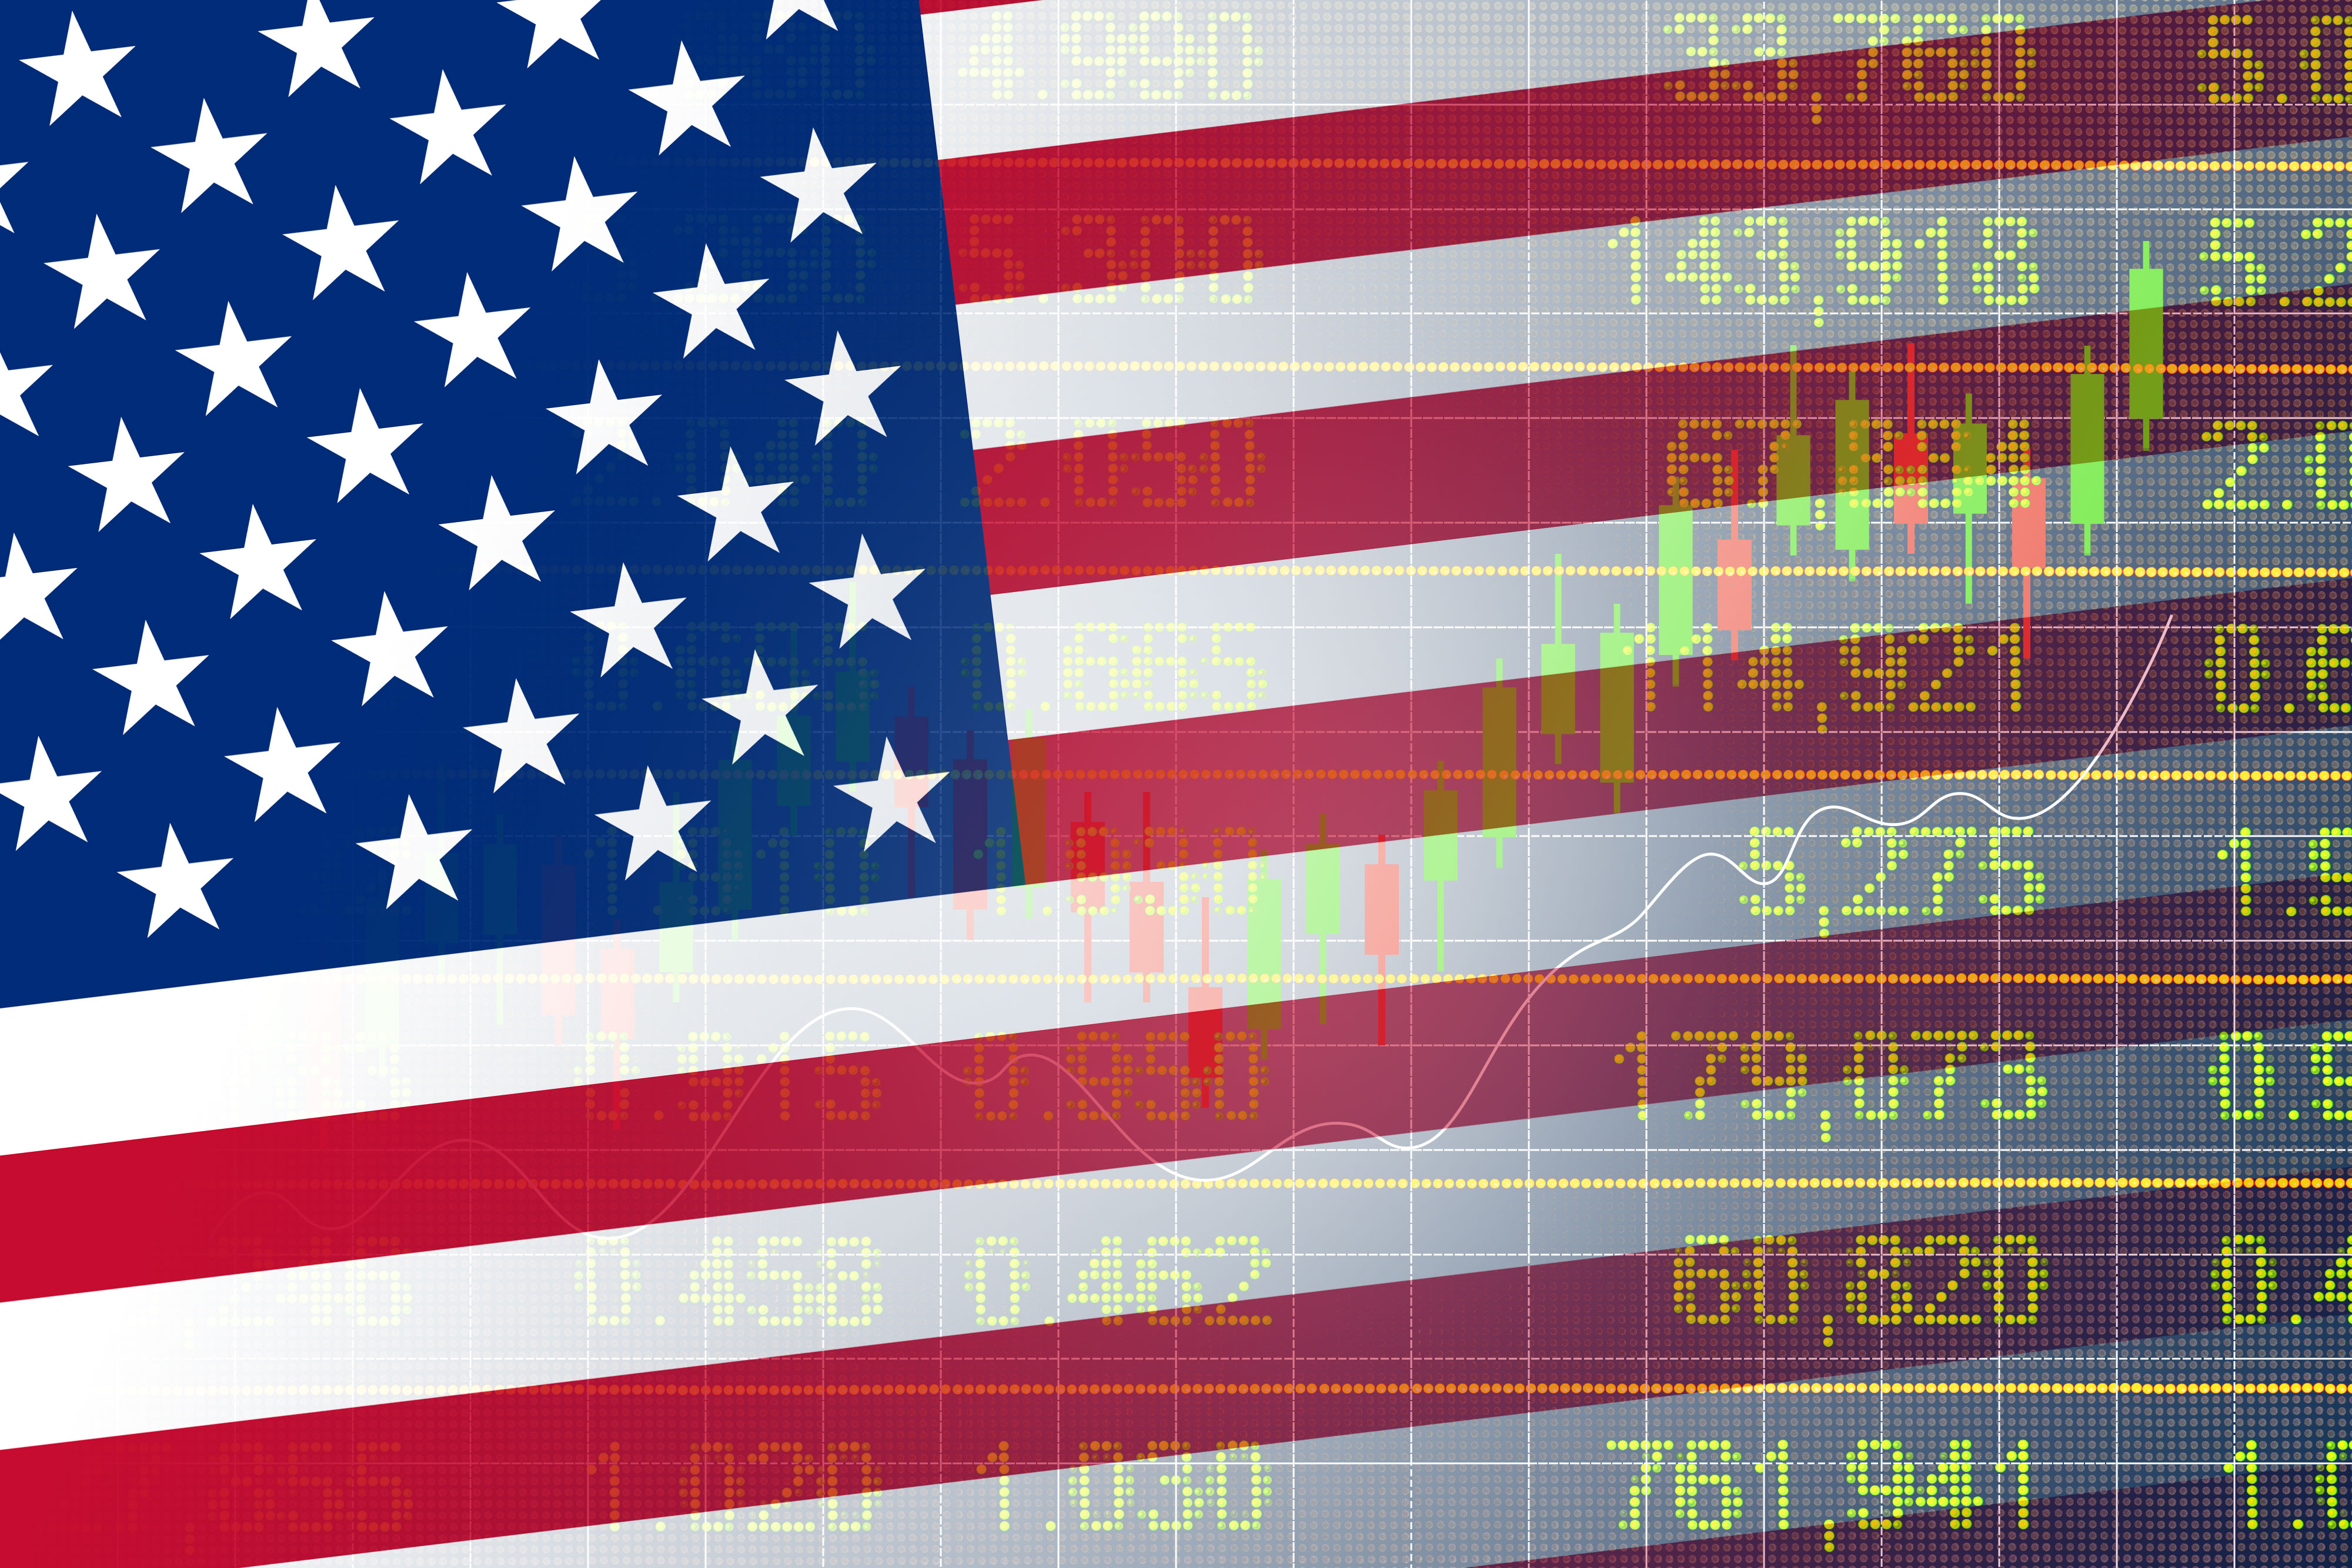
US Stock Market - Investing in the United States.jpg - Forextime

UK Stock Market - Investing in the United Kingdom.jpg - Forextime
European Stock Market concept image.jpg - Forextime

Merval részvényindex 1998 01 01 2004 10 5.png - Bonbatya

OUTPRFRM Stock Score to make the right trade.jpg - Outprfrm
Wie funktionieren ETFs? Gut zu wissen - Tagesschau.webm - Tagesschau ARD

Shanghai Composite Index.webp - Wikideas1
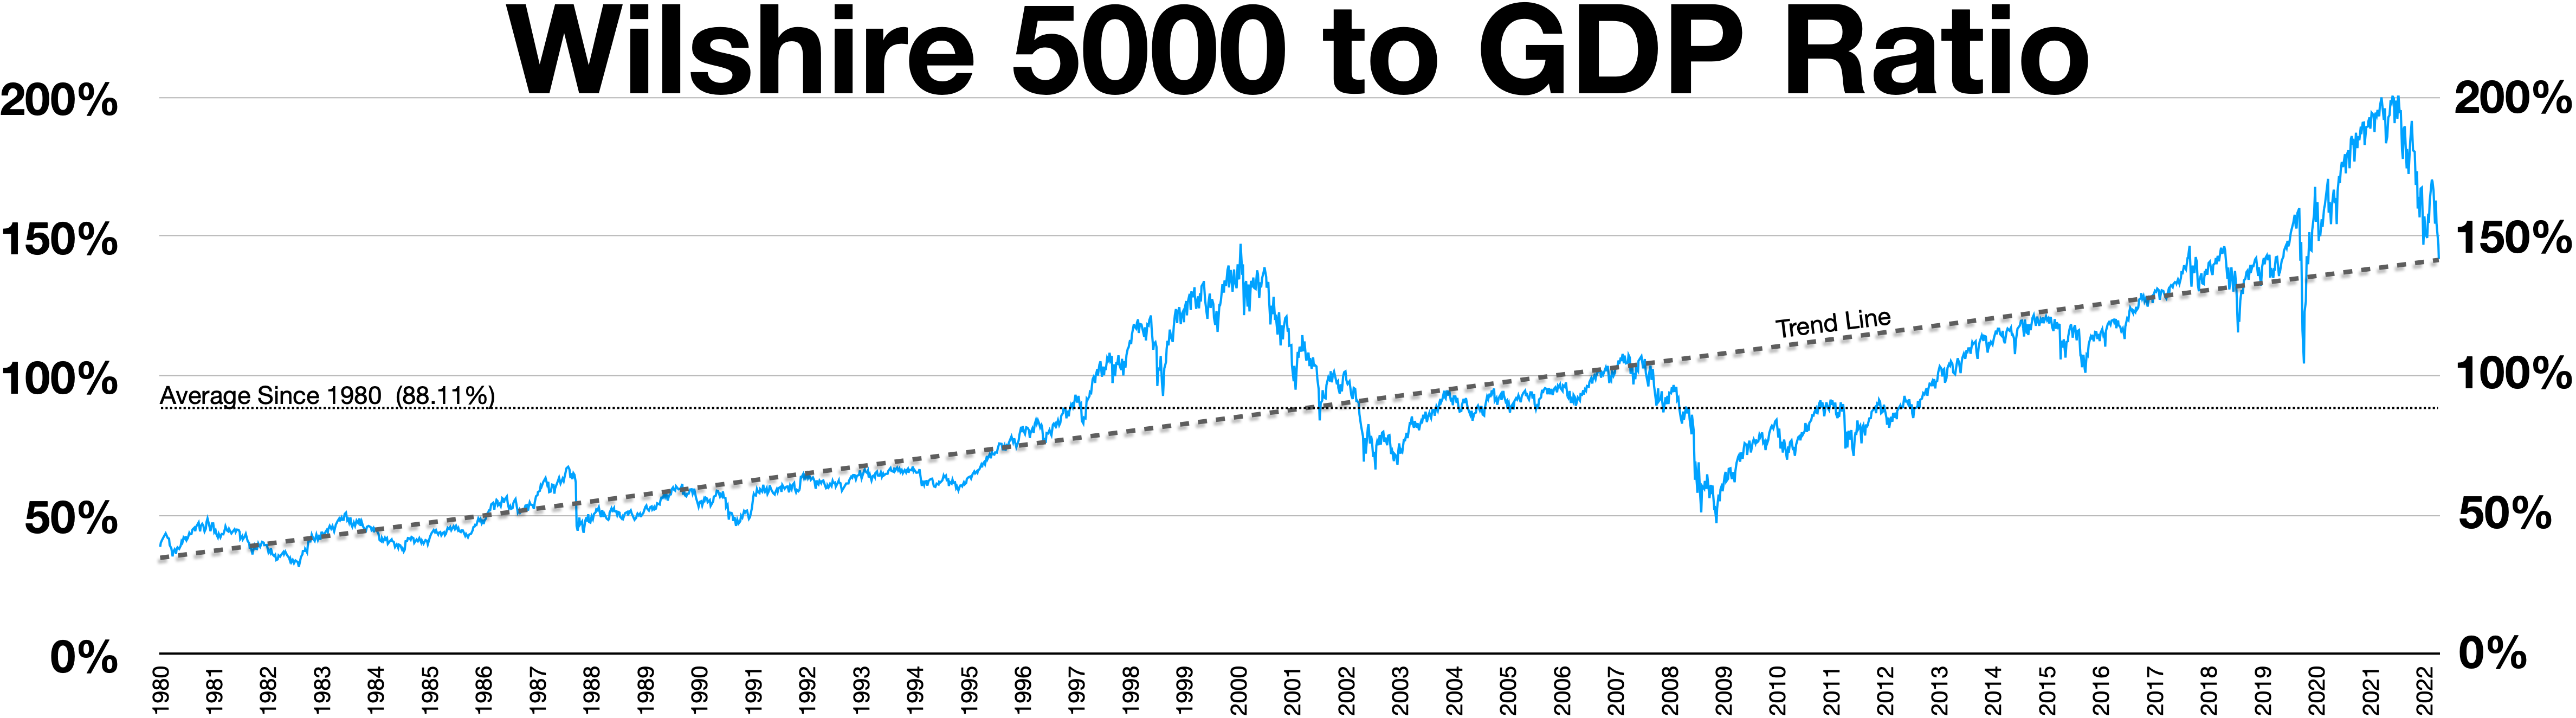
Wilshire 5000 to GDP ratio.webp - Wikideas1

Tokyo Stock Price Index - (TOPIX).webp - Wikideas1

NASDAQ 100 - Closing Prices from 1985 - 2024.png - Rospuda

Wilshire 5000 Index.webp - Wikideas1

FTSE 100 Index Line Chart (1984-2024) v1.jpg - Johnlexcameron

FTSE 250 Index Line Chart (1992-2024).jpg - Johnlexcameron

FTSE 350 Index Line Chart (1985-2024) v1.png - Johnlexcameron

FTSE SmallCap Index Line Chart (1993-2024).png - Johnlexcameron

FTSE All-Share Index Line Chart (1980-2024).png - Johnlexcameron
FTSE Fledgling Index Line Chart (2012-2024).png - Johnlexcameron
FTSE 100 logo.svg - Johnlexcameron
Ftse250 logo.svg - Johnlexcameron
FTSE350 logo.svg - Johnlexcameron
FTSE SmallCap logo.svg - Johnlexcameron
FTSE All-Share logo.svg - Johnlexcameron

Ftsemib 1998-2024.svg - Borduni

Ftsemib 1998-2024 new.svg - Borduni
Dow Jones Transportation Average.webp - Wikideas1