Wikimedi'Òc
Modes d'emploi

Cet album fait partie des albums
Cet album photos contient les sous-albums suivants :


Kth-pair-middle-of-middle.svg - JordiGH

Kth-pair-less-than.svg - JordiGH

Kth-pair-greater-than.svg - JordiGH

Kth-pair-row-medians-compared.svg - JordiGH

Kth-pair-row-medians.svg - JordiGH

Kth-pair-row-medians-aligned.svg - JordiGH

Juri-yang.png - Fzabala

SCMGermany.png - Wanwa

Singular spectrum analysis grouped reconstruction.svg - InverseHypercube
Estimation of a mean height curve for boys from the Berkeley Growth Study with and without warping.gif - Larslau

Why-Publishing-Everything-Is-More-Effective-than-Selective-Publishing-of-Statistically-Significant-pone.0084896.t001.jpg - Recitation-bot

Sequence analysis basic concepts.jpg - CBrzFay
Statistical Inference.pdf - Serik Sagitov (Chalmers)

Formula probabilità.jpg - Slark25
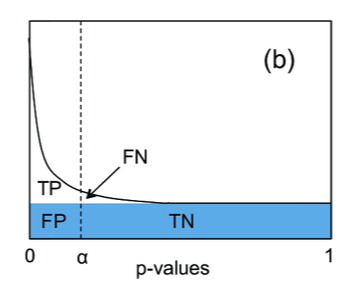
Storey-Tibshirani procedure.png - Biggerj1

One step prediction MSE.png - Hikenstuff

Figure 2 Minimum Position MSE vs. N.png - Hikenstuff
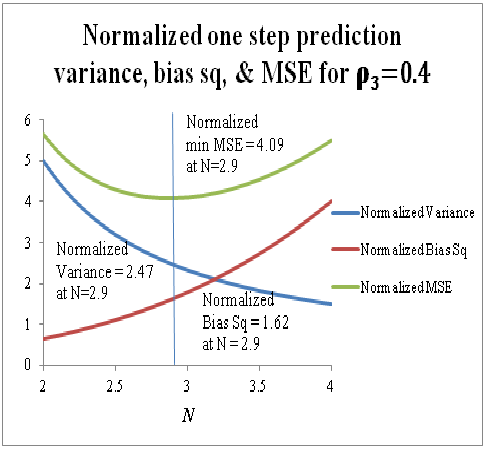
Figure 1 One step prediction MSE.png - Hikenstuff

Figure 2 Minimum positions MSE.png - Hikenstuff

Figure 3 Position variances and MSE.png - Hikenstuff

Figure 4 Optimal FOE position RMSE.png - Hikenstuff

Figure 6 Predictor IMMA & Opt FOE MSE comparison.png - Hikenstuff

Figure 7 Normalized predictor comparison.png - Hikenstuff

Figure 5 Comparison of mu2 vs f 3,opt.png - Hikenstuff