Wikimedi'Òc
Modes d'emploi

Cet album fait partie des albums
Cet album photos contient les sous-albums suivants :


Distribution of SAT scores by race-ethnicity.png - GifTagger

紅葉のなかで、里山の古道を ゆっくりと散策する。パイロット ペン習字 (30696239322).jpg - SteinsplitterBot
2003 SAT by race-ethnicity.png - Dd2

Hunters Point Library td (2019-09-24) 047.jpg - Tdorante10

Hunters Point Library td (2019-09-24) 046.jpg - Tdorante10

ציוני המבחן הפסיכומטרי.png - Israeli Homo Sapiens

Average SAT Scores by Racial and Ethnic Group 2018.PNG - Stilfehler
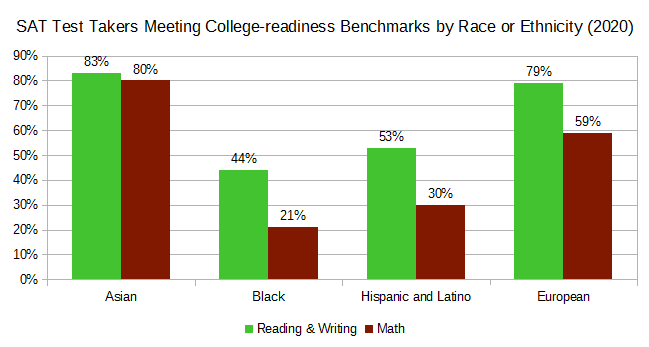
SAT College-readiness Benchmarks.png - Nerd271

Graduate Majors and GRE Averages.png - Nerd271

Distributions of SAT Math Scores by Race or Ethnicity.png - Nerd271

Princeton-1925-test-three.png - Erjwiki

SAT-1926-Scoring-Report.png - Erjwiki

Percent ACT Composite Scores of 36.svg - Erjwiki

PISA Math Scores (2018).png - Nerd271

PISA Science Scores (2018).png - Nerd271
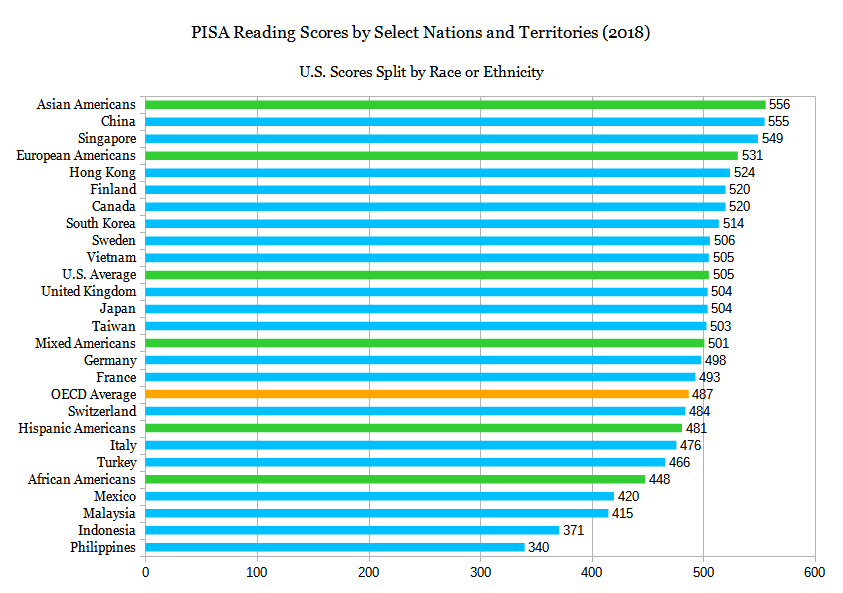
PISA Reading Scores (2018).png - Nerd271
TOEFL logo 2024.svg - DatBot
GRE logo 2024.svg - DatBot

Scantron 888P+ machine (background removed).png - Packer1028

Scantron 888P+ machine.jpg - Packer1028
Logo Medical College Admission Test.svg - Mrmw
Students who scored 600 or more on the math SAT.gif - BetacommandBot

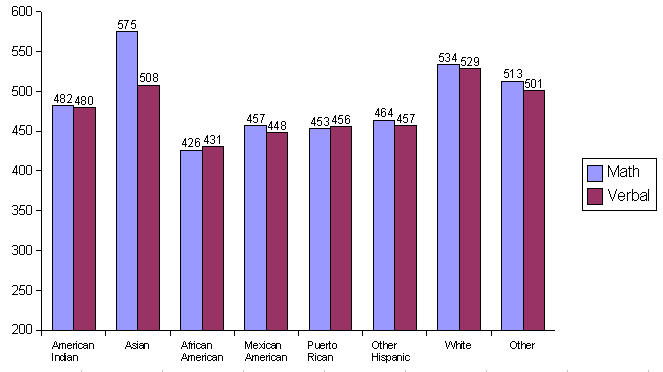
SAT-math-by-race-ethnicity.png - R.O.C

SAT-verbal-by-race-ethnicity.png - R.O.C

Authentic표.png - Yuin

Actual vs. Normalized Marks in GATE.png - Engineering Guy