Wikimedi'Òc
Modes d'emploi

Cet album fait partie des albums
Cet album photos contient les sous-albums suivants :


MathieuFloquet.gif - Maksim

MathieuC shortwave.gif - Maksim

MathieuCPrime shortwave.gif - Maksim
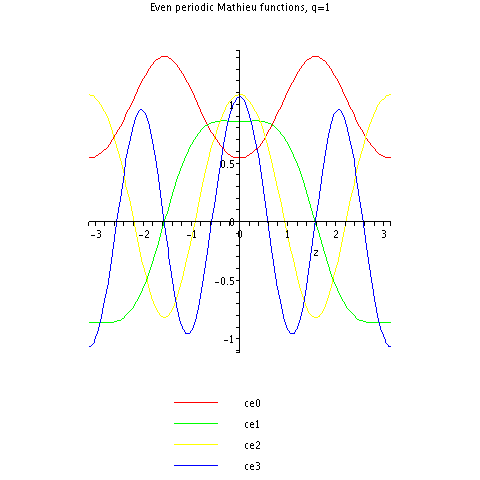
MathieuCE.gif - Maksim

Raised Cosine.png - Maksim

JacobiFunctionAbstract.png - Bhaskara~commonswiki

KWW dist. function linear.png - Somoza

KWW dist. funct. log.png - Somoza
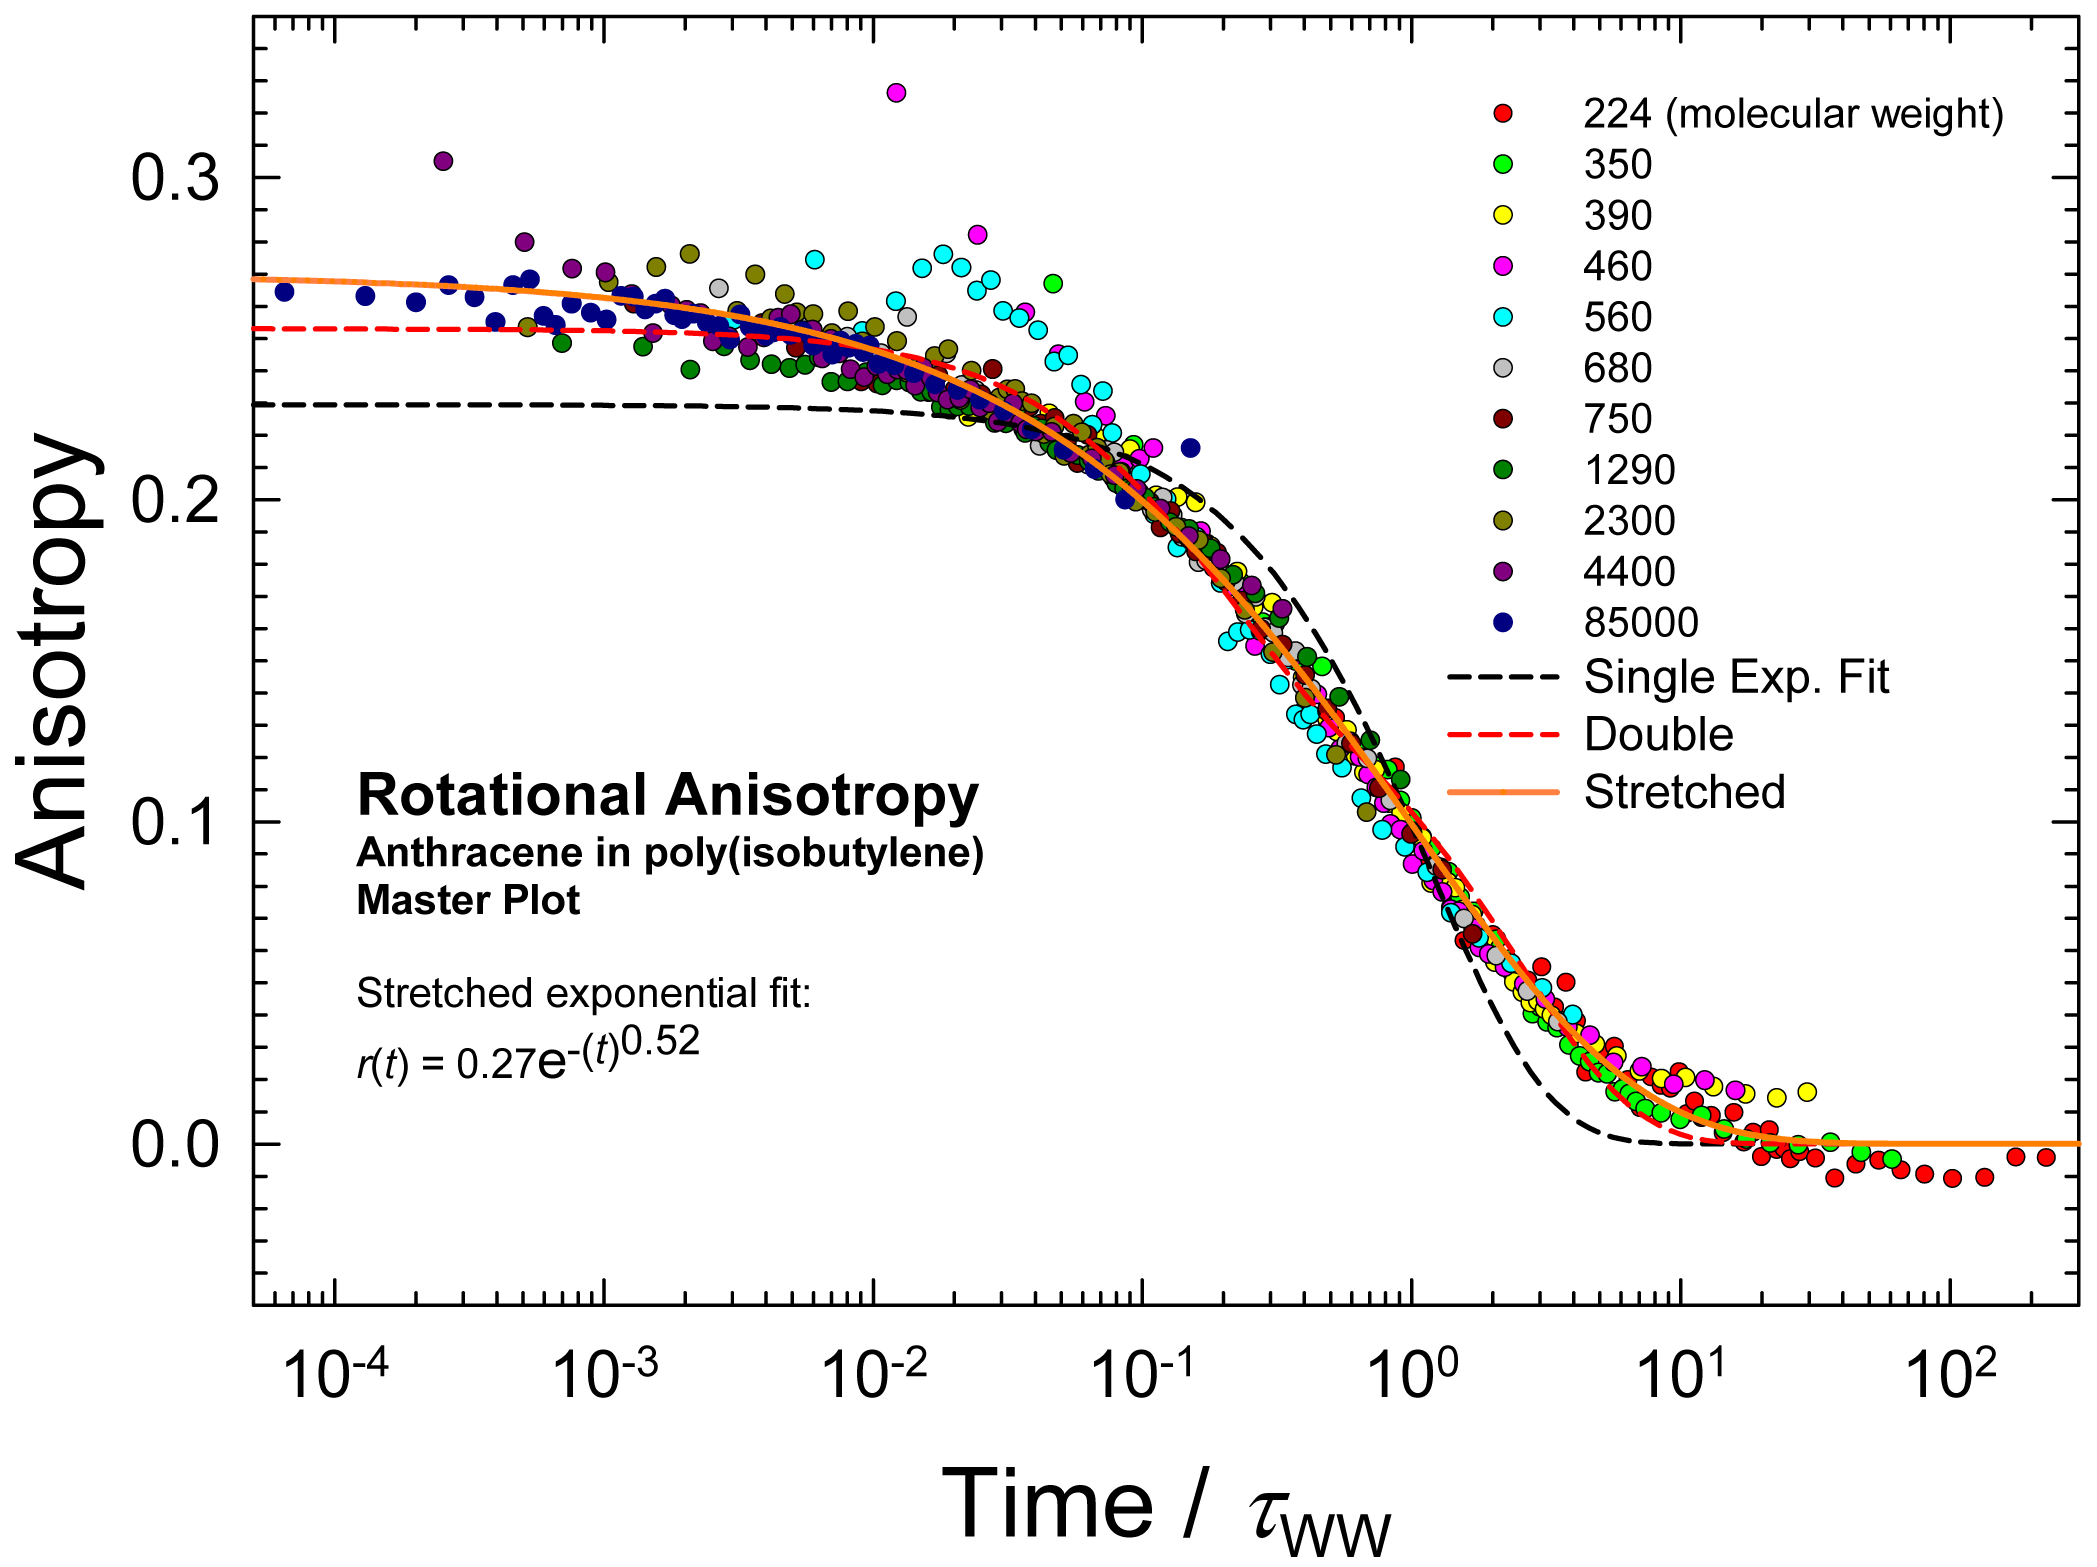
Pibmasterplot.png - Somoza
Fibonacci continuous.png - Kn
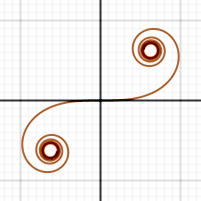
Cornu spiral.png - Spiritia

Eisenstein 4.jpg - Jan Homann

Eisenstein 6.jpg - Jan Homann

Eisenstein 8.jpg - Jan Homann

Eisenstein 10.jpg - Jan Homann

Eisenstein 12.jpg - Jan Homann

Eisenstein 14.jpg - Jan Homann
Dedekind Eta.jpg - Jan Homann
KleinInvariantJ.jpg - Jan Homann
Lucas continuous.png - Kn

Hyperbolic functions.svg - OgreBot
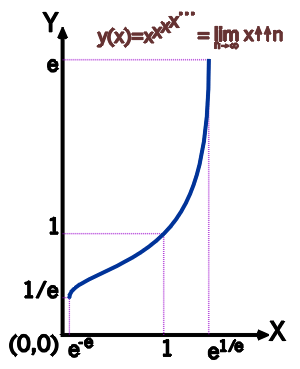
InfinitePowerTower.gif - 爪丹了

Lambert Wien 001.png - Cmdrjameson

Gjl-g a,b(x).png - Georg-Johann

Gjl-w a(x).png - Georg-Johann

X raised by x.svg - Geek3

Complex theta minus0point1times e i pi 0point1.jpg - Jan Homann

Riemann Siegel Theta 1.jpg - Jan Homann

Riemann Siegel Theta 2.jpg - Jan Homann
Riemann Siegel Theta 3.jpg - Jan Homann

Incircles.JPG - L mammel~commonswiki

Complex Riemann Xi.jpg - Jan Homann

Boxcar function approximation.png - SPat

DickmanRho.png - CRGreathouse

Boubaker Polynomials (n=0-6), x=(-2,2).svg - Inductiveload

Pibmasterplot fr.png - Gilles Mairet

KWW dist. function linear fr.png - Cmdrjameson

KWW dist. funct. log fr.png - Cmdrjameson

Logarithmicpmf.svg - Qwfp

Easement Curve.png - Ling Kah Jai~commonswiki

Hyperbolic functions-2.svg - Stigmatella aurantiaca

Raiz cubica.png - Santmique

Raíz cúbica de un quebrado común.png - Santmique

Hyperbolic and Circular Conic Sections Combined.png - Kmarinas86

Euler-bqf-2x2.PNG - HenryWJ

Easement curve.svg - Dingens5

Cosine integral.svg - Krishnavedala

Infinite power tower.svg - AJRobbins

X to x power showing minimum.svg - Dcoetzee

JacobiSN.png - Gisling

JacobiCN.png - Gisling

JacobiDN plot.png - Gisling

Mplwp dirichlet beta.svg - Geek3

Mplwp dilogarithm.svg - Geek3

Mplwp dilogarithm complex.svg - Geek3

LommelS1.png - Gisling

LommelS2.png - Gisling

Graph of the Fabius function between 0 and 1.png - Gro-Tsen

Graph of the Fabius function.png - Gro-Tsen

Bernoulli polynomials no title.svg - Mx. Granger

KelvinKei.png - 唐戈
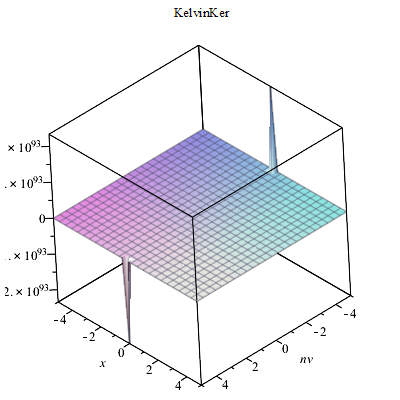
KelvinKer.png - 唐戈

KelvinBer.png - 唐戈

KelvinBei.png - 唐戈

Qsin.gif - 唐戈

Weber3d.png - 唐戈

WhittakerM 02.png - 唐戈

WhittakerM 01.png - 唐戈

Jacobi theta 1.png - Mikhail Ryazanov

Jacobi theta 2.png - Mikhail Ryazanov

Jacobi theta 3.png - Mikhail Ryazanov

Jacobi theta 4.png - Mikhail Ryazanov

Sigmoid function 02.png - 唐戈

Askey Scheme hypergeom orthogonal polynomials.png - 唐戈

Askey Scheme hypergeometric orthogonal polynomials.jpg - 唐戈

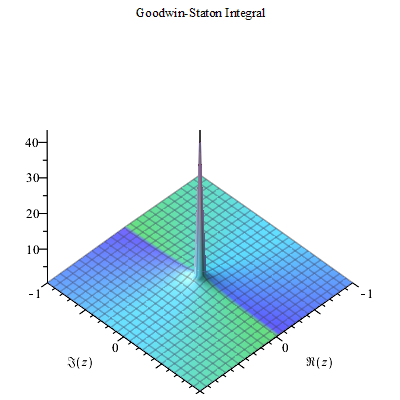
Goodwin-Staton Integral.png - 唐戈

Coulomb G function plot.png - 唐戈

Coulomb F function plot.png - 唐戈

Buchstab-function-graph-from-1-to-4.png - Spacepotato

Pearcey Integral Maple contour plot.png - 唐戈

Pearcey Integral 3D Maple plot.png - Gisling

Pearcey Integral Maple density plot.png - 唐戈

Stokes set of Pearcey Integral.png - 唐戈

Bifurcation of Pearcey Integral.png - 唐戈

Catastrophe Cusp of Pearcey Integral.png - 唐戈

Swallowtail integral Bifurcation catastrophe.png - 唐戈

Swallowtail integral Stokes set 1.png - 唐戈

Swallowtail integral Stokes set 2.png - 唐戈

Swallowtail integral catastrophe for z=0.png - 唐戈

Swallowtail Integral Maple 3D plot.png - 唐戈

SwaIntegral Maple density plotllowtail.png - 唐戈

Swallowtail Integral Maple contour plot.png - 唐戈
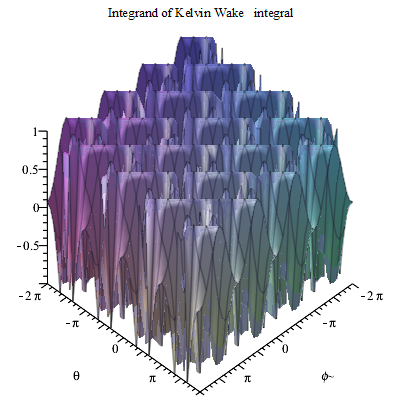
Integrand of Kelvin Wake Integral.png - 唐戈

Kelvin Ship Wake Integrand contour Maple plot.png - 唐戈

Kelvin Wakes contour plot.png - 唐戈

Kelvin Wakes density plot.png - 唐戈

Maple density plot of Kelvin Wake.png - 唐戈

Fadeeva Function.png - Gisling

Neutralisers.png - Gisling
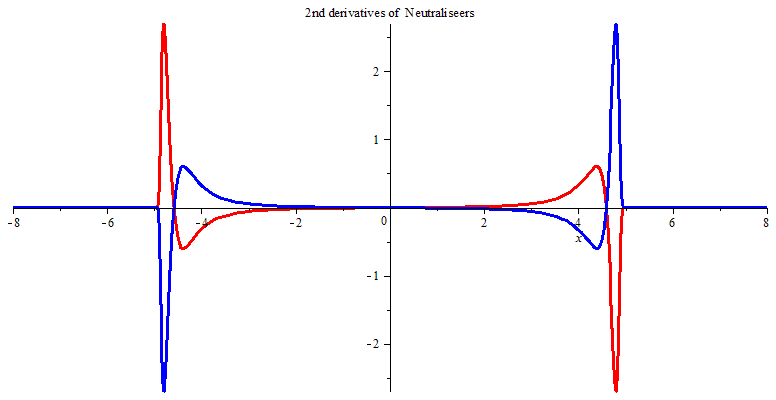
Second derivatives of Neutralisers.png - Gisling

First derivatives of Neutralisers.png - Gisling

KleinjCont.png - Empet23

KleinjHSV.png - Empet23

NevilleThetaN.png - 唐戈
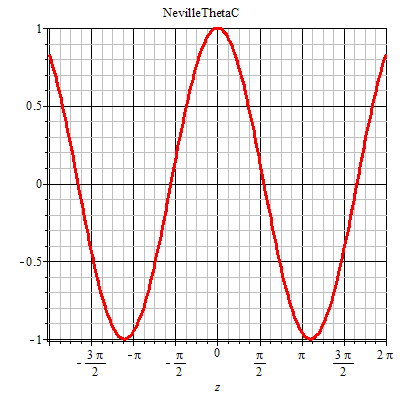
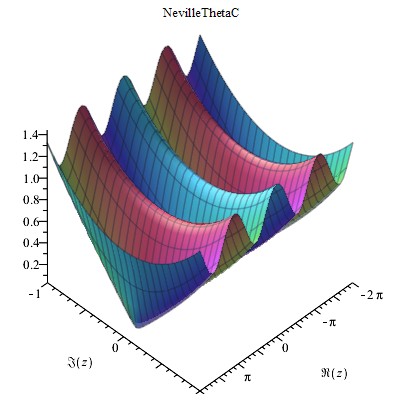
NevilleThetaC.png - 唐戈

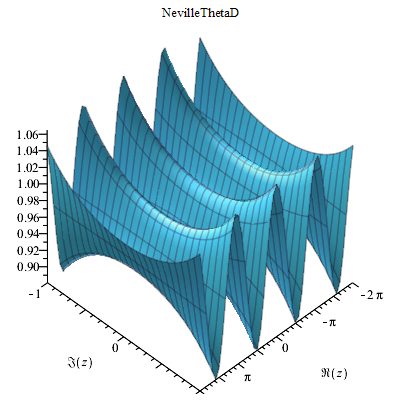
NevilleThetaD.png - 唐戈
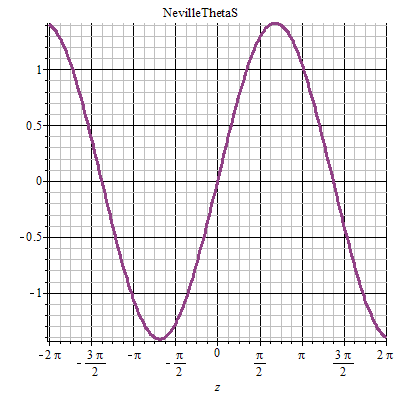
NevilleThetaS.png - 唐戈
NevilleThetaC Maple complex plot 01.png - 唐戈

NevilleThetaN Maple complex plot.png - 唐戈
NevilleThetaD Maple complex plot.png - 唐戈

NevilleThetaS Maple complex plot.png - 唐戈
Goodwin-Station integral Maple complex 3D plot.png - Gisling

Goodwin-staton integral derivative 2D plot.png - Gisling

Goodwin-Staton integral Im density plot.JPG - Gisling

Goodwin-staton integral Im complex 3D plot.png - Gisling

Goodwin-staton integral derivative Re 3D plot.png - Gisling

Mplwp Fabius function.svg - Geek3

RogersRamanujan400.png - Empet23

Rogers400.png - Empet23

Mplwp Dickman function.svg - Geek3

Mplwp Dickman function log.svg - Geek3
Generalisation of Euler–Mascheroni constant.jpg - (ʘ̢̡̑ʘ̑)

Rogers dilogarithm.svg - Kilom691

Chebyshev Zeros.svg - Rayhem

Чёртова лестница.png - Владислав Молдован

Legendre smoothing filter.png - Rayhem

Legendre MRA filter.svg - Rayhem

Bernstein polynomials.svg - Rayhem

Klff.png - Sophiar-k

Tosinus.png - Vendetta152
Singularity function.jpg - Sigma'am

Mplwp arithmetic-geometric mean.svg - Geek3

Solution-set-2.png - Hippymoose17
Gamma function.gif - Berto

Brjuno function.png - Soul windsurfer

Knotenlinien sin xy RK02.svg - Roderich Kahn

Chapman function.svg - Maximilian Reininghaus
2022-08-09 12 43 26-Barnes-G from -6 to 4.png - Doc.Acid

2022-07-30 18 07 05-Barnes-G zoomed.png - Doc.Acid

Regular Coulomb wave function F plotted from 0 to 20 with repulsive and attractive interactions in Mathematica.svg - WalkingRadiance

Irregular Coulomb wave function G plotted from 0 to 20 with repulsive and attractive interactions in Mathematica.svg - WalkingRadiance

Complex Plot of the regular Coulomb wave function from -2-2i to 2+2i in three dimensions created with Mathematica.svg - WalkingRadiance

Gamma Function plotted in the complex plane in three dimensions with Mathematica ComplexPlot3D.svg - WalkingRadiance

Plot of gamma function in the complex plane from -2-i to 6+2i with colors created in Mathematica.svg - WalkingRadiance

Absolute argument plot of the gamma function from z=-4 to 7 created in Mathematica 13.1.svg - WalkingRadiance

Beta Function plotted in the complex plane in three dimensions with Mathematica 13.1's ComplexPlot3D.svg - WalkingRadiance

Plot of logarithmic gamma function in the complex plane from -2-2i to 2+2i with colors created with Mathematica 13.1 function ComplexPlot3D.svg - WalkingRadiance

Plot of polygamma function in the complex plane from -2-2i to 2+2i with colors created with Mathematica 13.1.svg - WalkingRadiance

Plot of the regularized incomplete gamma function Q(2,z) in the complex plane from -2-2i to 2+2i with colors created with Mathematica 13.1 function ComplexPlot3D.svg - WalkingRadiance

Plot of the Barnes G aka double gamma function G(z) in the complex plane from -2-2i to 2+2i with colors created with Mathematica 13.1 function ComplexPlot3D.svg - WalkingRadiance

Plot of the error function Erf(z) in the complex plane from -2-2i to 2+2i with colors created with Mathematica 13.1 function ComplexPlot3D.svg - WalkingRadiance

Plot of the cosine integral function Ci(z) in the complex plane from -2-2i to 2+2i with colors created with Mathematica 13.1 function ComplexPlot3D.svg - WalkingRadiance

Plot of the complementary error function Erfc(z) in the complex plane from -2-2i to 2+2i with colors created with Mathematica 13.1 function ComplexPlot3D.svg - WalkingRadiance

Plot of the imaginary error function Erfi(z) in the complex plane from -2-2i to 2+2i with colors created with Mathematica 13.1 function ComplexPlot3D.svg - WalkingRadiance

Plot of the Dawson integral function F(z) in the complex plane from -2-2i to 2+2i with colors created with Mathematica 13.1 function ComplexPlot3D.svg - WalkingRadiance

Plot of the Fresnel integral function S(z) in the complex plane from -2-2i to 2+2i with colors created with Mathematica 13.1 function ComplexPlot3D.svg - WalkingRadiance

Plot of the sine integral function Si(z) in the complex plane from -2-2i to 2+2i with colors created with Mathematica 13.1 function ComplexPlot3D.svg - WalkingRadiance

Plot of the exponential integral function Ei(z) in the complex plane from -2-2i to 2+2i with colors created with Mathematica 13.1 function ComplexPlot3D.svg - WalkingRadiance

Plot of the logarithmic integral function li(z) in the complex plane from -2-2i to 2+2i with colors created with Mathematica 13.1 function ComplexPlot3D.svg - WalkingRadiance

Plot of the exponential integral function E n(z) with n=2 in the complex plane from -2-2i to 2+2i with colors created with Mathematica 13.1 function ComplexPlot3D.svg - WalkingRadiance

Plot of the Fresnel auxillary function F(z) in the complex plane from -2-2i to 2+2i with colors created with Mathematica 13.1 function ComplexPlot3D.svg - WalkingRadiance

Plot of the Fresnel auxillary function G(z) in the complex plane from -2-2i to 2+2i with colors created with Mathematica 13.1 function ComplexPlot3D.svg - WalkingRadiance

Plot of the Fresnel integral function C(z) in the complex plane from -2-2i to 2+2i with colors created with Mathematica 13.1 function ComplexPlot3D.svg - WalkingRadiance

Plot of the hyperbolic cosine integral function Chi(z) in the complex plane from -2-2i to 2+2i with colors created with Mathematica 13.1 function ComplexPlot3D.svg - WalkingRadiance

Plot of the hyperbolic sine integral function Shi(z) in the complex plane from -2-2i to 2+2i with colors created with Mathematica 13.1 function ComplexPlot3D.svg - WalkingRadiance

Plot of the Gegenbauer polynomial C n^(m)(x) with n=10 and m=1 in the complex plane from -2-2i to 2+2i with colors created with Mathematica 13.1 function ComplexPlot3D.svg - WalkingRadiance

Plot of the Chebyshev polynomial of the first kind T n(x) with n=5 in the complex plane from -2-2i to 2+2i with colors created with Mathematica 13.1 function ComplexPlot3D.svg - WalkingRadiance

Plot of the Jacobi polynomial function P n^(a,b) with n=10 and a=2 and b=2 in the complex plane from -2-2i to 2+2i with colors created with Mathematica 13.1 function ComplexPlot3D.svg - WalkingRadiance

Plot of the spherical harmonic Y l^m(theta,phi) with n=2 and m=1 and phi=pi in the complex plane from -2-2i to 2+2i with colors created with Mathematica 13.1 function ComplexPlot3D.svg - WalkingRadiance

Plot of the Bessel function of the first kind J n(z) with n=0.5 in the complex plane from -2-2i to 2+2i with colors created with Mathematica 13.1 function ComplexPlot3D.svg - WalkingRadiance

Plot of the spherical Hankel function of the second kind h n^(2)(z) with n=-0.5 in the complex plane from -2-2i to 2+2i with colors created with Mathematica 13.1 function ComplexPlot3D.svg - WalkingRadiance

Plot of the Bessel function of the second kind Y n(z) with n=0.5 in the complex plane from -2-2i to 2+2i with colors created with Mathematica 13.1 function ComplexPlot3D.svg - WalkingRadiance

Plot of the spherical Hankel function of the first kind h n^(1)(z) with n=-0.5 in the complex plane from -2-2i to 2+2i with colors created with Mathematica 13.1 function ComplexPlot3D.svg - WalkingRadiance

Plot of the Hankel function of the first kind H n^(1)(z) with n=-0.5 in the complex plane from -2-2i to 2+2i with colors created with Mathematica 13.1 function ComplexPlot3D.svg - WalkingRadiance

Plot of the Hankel function of the second kind H n^(2)(z) with n=-0.5 in the complex plane from -2-2i to 2+2i with colors created with Mathematica 13.1 function ComplexPlot3D.svg - WalkingRadiance

Plot of the spherical Bessel function of the second kind y n(z) with n=0.5 in the complex plane from -2-2i to 2+2i with colors created with Mathematica 13.1 function ComplexPlot3D.svg - WalkingRadiance

Plot of the spherical Bessel function of the first kind j n(z) with n=0.5 in the complex plane from -2-2i to 2+2i with colors created with Mathematica 13.1 function ComplexPlot3D.svg - WalkingRadiance

Plot of the derivative of the Scorer function Hi'(z) in the complex plane from -2-2i to 2+2i with colors created with Mathematica 13.1 function ComplexPlot3D.svg - WalkingRadiance

Plot of the derivative of the Scorer function Gi'(z) in the complex plane from -2-2i to 2+2i with colors created with Mathematica 13.1 function ComplexPlot3D.svg - WalkingRadiance

Plot of the Scorer function Hi(z) in the complex plane from -2-2i to 2+2i with colors created with Mathematica 13.1 function ComplexPlot3D.svg - WalkingRadiance

Plot of the Airy function Bi(z) in the complex plane from -2-2i to 2+2i with colors created with Mathematica 13.1 function ComplexPlot3D.svg - WalkingRadiance

Plot of the Scorer function Gi(z) in the complex plane from -2-2i to 2+2i with colors created with Mathematica 13.1 function ComplexPlot3D.svg - WalkingRadiance

Plot of the derivative of the Airy function Bi'(z) in the complex plane from -2-2i to 2+2i with colors created with Mathematica 13.1 function ComplexPlot3D.svg - WalkingRadiance

Plot of the derivative of the Airy function Ai'(z) in the complex plane from -2-2i to 2+2i with colors created with Mathematica 13.1 function ComplexPlot3D.svg - WalkingRadiance

Plot of the Airy function Ai(z) in the complex plane from -2-2i to 2+2i with colors created with Mathematica 13.1 function ComplexPlot3D.svg - WalkingRadiance

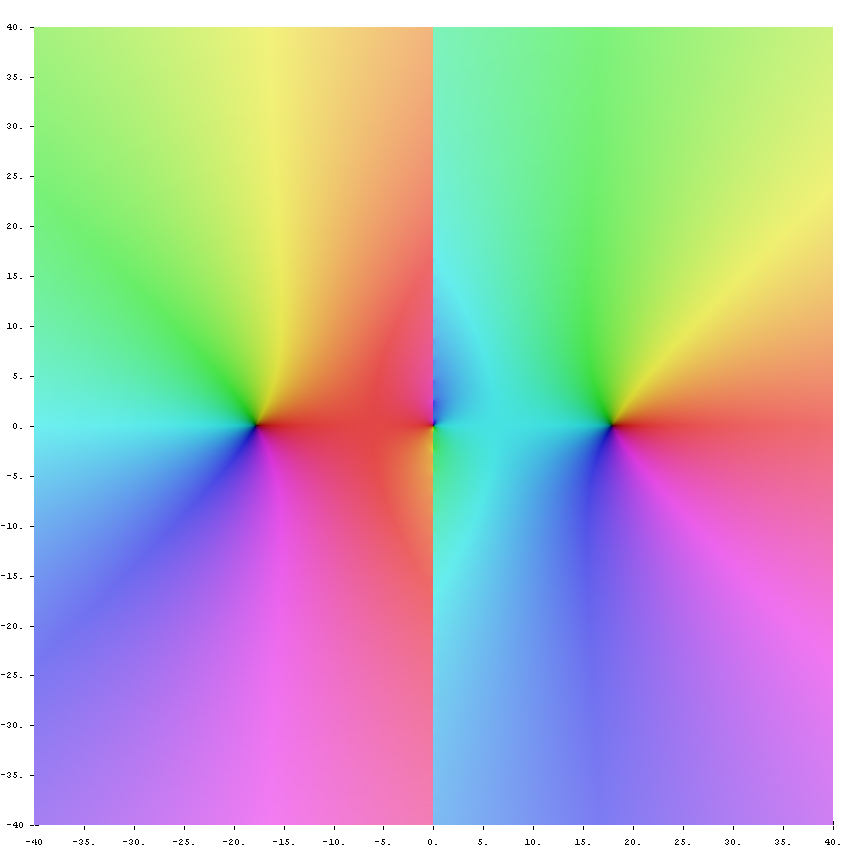
Plot of the Kelvin function ber(z) in the complex plane from -2-2i to 2+2i with colors created with Mathematica 13.1 function ComplexPlot3D.svg - WalkingRadiance

Plot of the Kelvin function kei(z) in the complex plane from -2-2i to 2+2i with colors created with Mathematica 13.1 function ComplexPlot3D.svg - WalkingRadiance

Plot of the Kelvin function ker(z) in the complex plane from -2-2i to 2+2i with colors created with Mathematica 13.1 function ComplexPlot3D.svg - WalkingRadiance

Plot of the Kelvin function bei(z) in the complex plane from -2-2i to 2+2i with colors created with Mathematica 13.1 function ComplexPlot3D.svg - WalkingRadiance

Plot of the Anger function J v(z) with n=2 in the complex plane from -2-2i to 2+2i with colors created with Mathematica 13.1 function ComplexPlot3D.svg - WalkingRadiance

Plot of the Weber function E v(z) with n=2 in the complex plane from -2-2i to 2+2i with colors created with Mathematica 13.1 function ComplexPlot3D.svg - WalkingRadiance

Plot of the modified Struve function L n(z) with n=2 in the complex plane from -2-2i to 2+2i with colors created with Mathematica 13.1 function ComplexPlot3D.svg - WalkingRadiance

Plot of the Struve function H n(z) with n=2 in the complex plane from -2-2i to 2+2i with colors created with Mathematica 13.1 function ComplexPlot3D.svg - WalkingRadiance

Plot of the hypergeometric function 2F1(a,b; c; z) with a=2 and b=3 and c=4 in the complex plane from -2-2i to 2+2i with colors created with Mathematica 13.1 function ComplexPlot3D.svg - WalkingRadiance

Plot of the Legendre polynomial P n(x) with n=0.5 in the complex plane from -2-2i to 2+2i with colors created with Mathematica 13.1 function ComplexPlot3D.svg - WalkingRadiance

Plot of the generalized hypergeometric function pFq(a b z) with a=(2,4,6,8) and b=(2,3,5,7,11) in the complex plane from -2-2i to 2+2i created with Mathematica 13.1 function ComplexPlot3D.svg - WalkingRadiance

Plot of the Legendre function of the second kind Q n(x) with n=0.5 in the complex plane from -2-2i to 2+2i with colors created with Mathematica 13.1 function ComplexPlot3D.svg - WalkingRadiance

Plot of gamma function in complex plane in 3D with color and legend and 1000 plot points created with Mathematica.svg - WalkingRadiance

Plot of the Meiger G function G(((a 1,...,a n),(a n+1,...,a p)),((b 1,...,b m),(b m+1,...,b q)),z) input ((½),()),((⅓),()) in the complex plane from -2-2i to 2+2i.svg - WalkingRadiance

Plot of the Fox H function H((((a 1,α 1),...,(a n,α n)),((a n+1,α n+1),...,(a p,α p)),(((b 1,β 1),...,(b m,β m)),in ((b m+1,β m+1),...,(b q,β q))),z) with H(((),()),(((-1,½)),()),z).svg - WalkingRadiance

Plot of the Kummer confluent hypergeometric function 1F1(a;b;z) with a=1 and b=2 and input z² with 1F1(1,2,z²) in the complex plane from -2-2i to 2+2i with colors created with Mathematica 13.1.svg - WalkingRadiance

Plot of the Whittaker function W k,m(z) with k=2 and m=½ in the complex plane from -2-2i to 2+2i with colors created with Mathematica 13.1 function ComplexPlot3D.svg - WalkingRadiance

Plot of the Whittaker function M k,m(z) with k=2 and m=½ in the complex plane from -2-2i to 2+2i with colors created with Mathematica 13.1 function ComplexPlot3D.svg - WalkingRadiance

Plot of the confluent hypergeometric function 0F1(;a;z) with a=sqrt(2) and the input=z^2 as 0F1(;sqrt(2);z) in the complex plane from -2-2i to 2+2i with colors created with Mathematica 13.1.svg - WalkingRadiance

Plot of the complex argument function arg(z) in the complex plane from -2-2i to 2+2i with colors created with Mathematica function ComplexPlot3D.svg - WalkingRadiance

Plot of the arithmetic-geometric mean function with 1 and z in the complex plane from -2-2i to 2+2i with colors created with Mathematica function ComplexPlot3D.svg - WalkingRadiance

Plot of the arctangent function arctan(z) in the complex plane from -2-2i to 2+2i with colors created with Mathematica function ComplexPlot3D.svg - WalkingRadiance

Plot of the arctangent function of z^2 arctan(z^2) in the complex plane from -2-2i to 2+2i with colors created with Mathematica function ComplexPlot3D.svg - WalkingRadiance

Plot of the Bateman function k n(z) with n=7 in the complex plane from -2-2i to 2+2i with colors created with Mathematica function ComplexPlot3D.svg - WalkingRadiance

A plot of the absolute value function abs(z) in the complex plane from -2-2i to 2+2i with colors created with the Mathematica function ComplexPlot3D.svg - WalkingRadiance

A plot of the Coshc function Cosh(z) in the complex plane from -2-2i to 2+2i with colors created with the Mathematica function ComplexPlot3D.svg - WalkingRadiance

A plot of the Sinhc function Sinhc(z) in the complex plane from -2-2i to 2+2i with colors created with the Mathematica function ComplexPlot3D.svg - WalkingRadiance

A plot of the tanhc function Tanhc(z) in the complex plane from -2-2i to 2+2i with colors created with the Mathematica function ComplexPlot3D.svg - WalkingRadiance

A plot of the cothc function Cothc(z) in the complex plane from -2-2i to 2+2i with colors created with the Mathematica function ComplexPlot3D.svg - WalkingRadiance

A plot of the sechc function Sechc(z) in the complex plane from -2-2i to 2+2i with colors created with the Mathematica function ComplexPlot3D.svg - WalkingRadiance

A plot of the cschc function cschc(z) in the complex plane from -2-2i to 2+2i with colors created with the Mathematica function ComplexPlot3D.svg - WalkingRadiance

A plot of the cschc function cschc(z^2) in the complex plane from -2-2i to 2+2i with colors created with the Mathematica function ComplexPlot3D.svg - WalkingRadiance

The ternary logarithm function logbase(3,z) plotted in the complex plane from -2-2i to 2+2i.svg - WalkingRadiance

The binary logarithm function lg(z) plotted in the complex plane from -2-2i to 2+2i.svg - WalkingRadiance

The natural logarithm function ln(z) plotted in the complex plane from -2-2i to 2+2i.svg - WalkingRadiance

The exponential function e^z plotted in the complex plane from -2-2i to 2+2i.svg - WalkingRadiance

The decimal logarithm function logbase(10,z) plotted in the complex plane from -2-2i to 2+2i.svg - WalkingRadiance

The sine function sin(z) plotted in the complex plane from -2-2i to 2+2i.svg - WalkingRadiance

The cotangent function cot(z) plotted in the complex plane from -2-2i to 2+2i.svg - WalkingRadiance

The tangent function tan(z) plotted in the complex plane from -2-2i to 2+2i.svg - WalkingRadiance

The secant function sec(z) plotted in the complex plane from -2-2i to 2+2i.svg - WalkingRadiance

The hyperbolic cosine function cosh(z) plotted in the complex plane from -2-2i to 2+2i.svg - WalkingRadiance

The cosine function cos(z) plotted in the complex plane from -2-2i to 2+2i.svg - WalkingRadiance

The cosecant function csc(z) plotted in the complex plane from -2-2i to 2+2i.svg - WalkingRadiance

The hyperbolic sine function sinh(z) plotted in the complex plane from -2-2i to 2+2i.svg - WalkingRadiance

The hyperbolic tangent function tanh(z) plotted in the complex plane from -2-2i to 2+2i.svg - WalkingRadiance

The hyperbolic secant function sech(z) plotted in the complex plane from -2-2i to 2+2i.svg - WalkingRadiance

The hyperbolic cottangent function coth(z) plotted in the complex plane from -2-2i to 2+2i.svg - WalkingRadiance

The hyperbolic cosecant function csch(z) plotted in the complex plane from -2-2i to 2+2i.svg - WalkingRadiance

The cardinal sine function sinc(z) plotted in the complex plane from -2-2i to 2+2i.svg - WalkingRadiance

The cardinal hyperbolic cosine function coshc(z) plotted in the complex plane from -2-2i to 2+2i.svg - WalkingRadiance

The cardinal hyperbolic sine function sinhc(z) plotted in the complex plane from -2-2i to 2+2i.svg - WalkingRadiance

The cardinal hyperbolic tangent function tanhc(z) plotted in the complex plane from -2-2i to 2+2i.svg - WalkingRadiance

The cardinal hyperbolic cotangent function cothc(z) plotted in the complex plane from -2-2i to 2+2i.svg - WalkingRadiance

The cardinal hyperbolic cosecant function cschc(z) plotted in the complex plane from -2-2i to 2+2i.svg - WalkingRadiance

The cardinal hyperbolic secant function sechc(z) plotted in the complex plane from -2-2i to 2+2i.svg - WalkingRadiance

The cardinal cosecant function cscc(z) plotted in the complex plane from -2-2i to 2+2i.svg - WalkingRadiance

The product logarithm Lambert W function plotted in the complex plane from -2-2i to 2+2i.svg - WalkingRadiance

The product logarithm Lambert W function W 2(z) plotted in the complex plane from -2-2i to 2+2i.svg - WalkingRadiance

Q function complex plot plotted with Mathematica 13.1 ComplexPlot3D.svg - WalkingRadiance

Normal cumulative distribution function complex plot in Mathematica 13.1 with ComplexPlot3D.svg - WalkingRadiance

Complex 3d plot the Bessel Clifford function evaluated at n=3 divided by 22 as C(3 divided 22,z) from -2-2i to 2+2i.svg - WalkingRadiance

Complex color plot of the Laguerre polynomial L n(x) with n as -1 divided by 9 and x as z to the power of 4 from -2-2i to 2+2i.svg - WalkingRadiance

Faddeeva Function Domain Colouring Plot.svg - MothNik

Von Bertalanffy function.svg - HB