Wikimedi'Òc
Modes d'emploi

Cet album fait partie des albums
Cet album photos contient les sous-albums suivants :


Societal development.png - Piotrus

Punch 1843 - Reichtum und Armut.png - Michael Reschke

Disparitaetendiagramm.png - Cmdrjameson

Howells, Stops of Various Quills, 1895 063 large a.jpg - Londonjackbooks
Universal suffrage audio.ogg - FSII

Inequality-by-Kenworthy.png - OgreBot

Hilbert Gini individuals worldwide.PNG - Myworkforwiki

"Ela queria brincar de casinha.JPG - AgenciaKairos

Fome de Democracia.jpg - 2RPC2015

Shirin Sharmin Chaudhury in Aid for Gender Equality (11433083255).jpg - Moheen

Indicadores del desarrollo mundial.png - Gianfanton
Cuadro 1.1.png - Gianfanton

Actors of foreign aid Q&A (11433110624).jpg - Natuur12

ReCom results meeting- Aid for Gender Equality. Copenhagen, Denmark (11465683364).jpg - Natuur12

Rajbanshi vhes.jpg - Mukeshrz

GlobalBandwidthConcentration.jpg - Myworkforwiki

BandwidthInequality1986-2014.jpg - Myworkforwiki
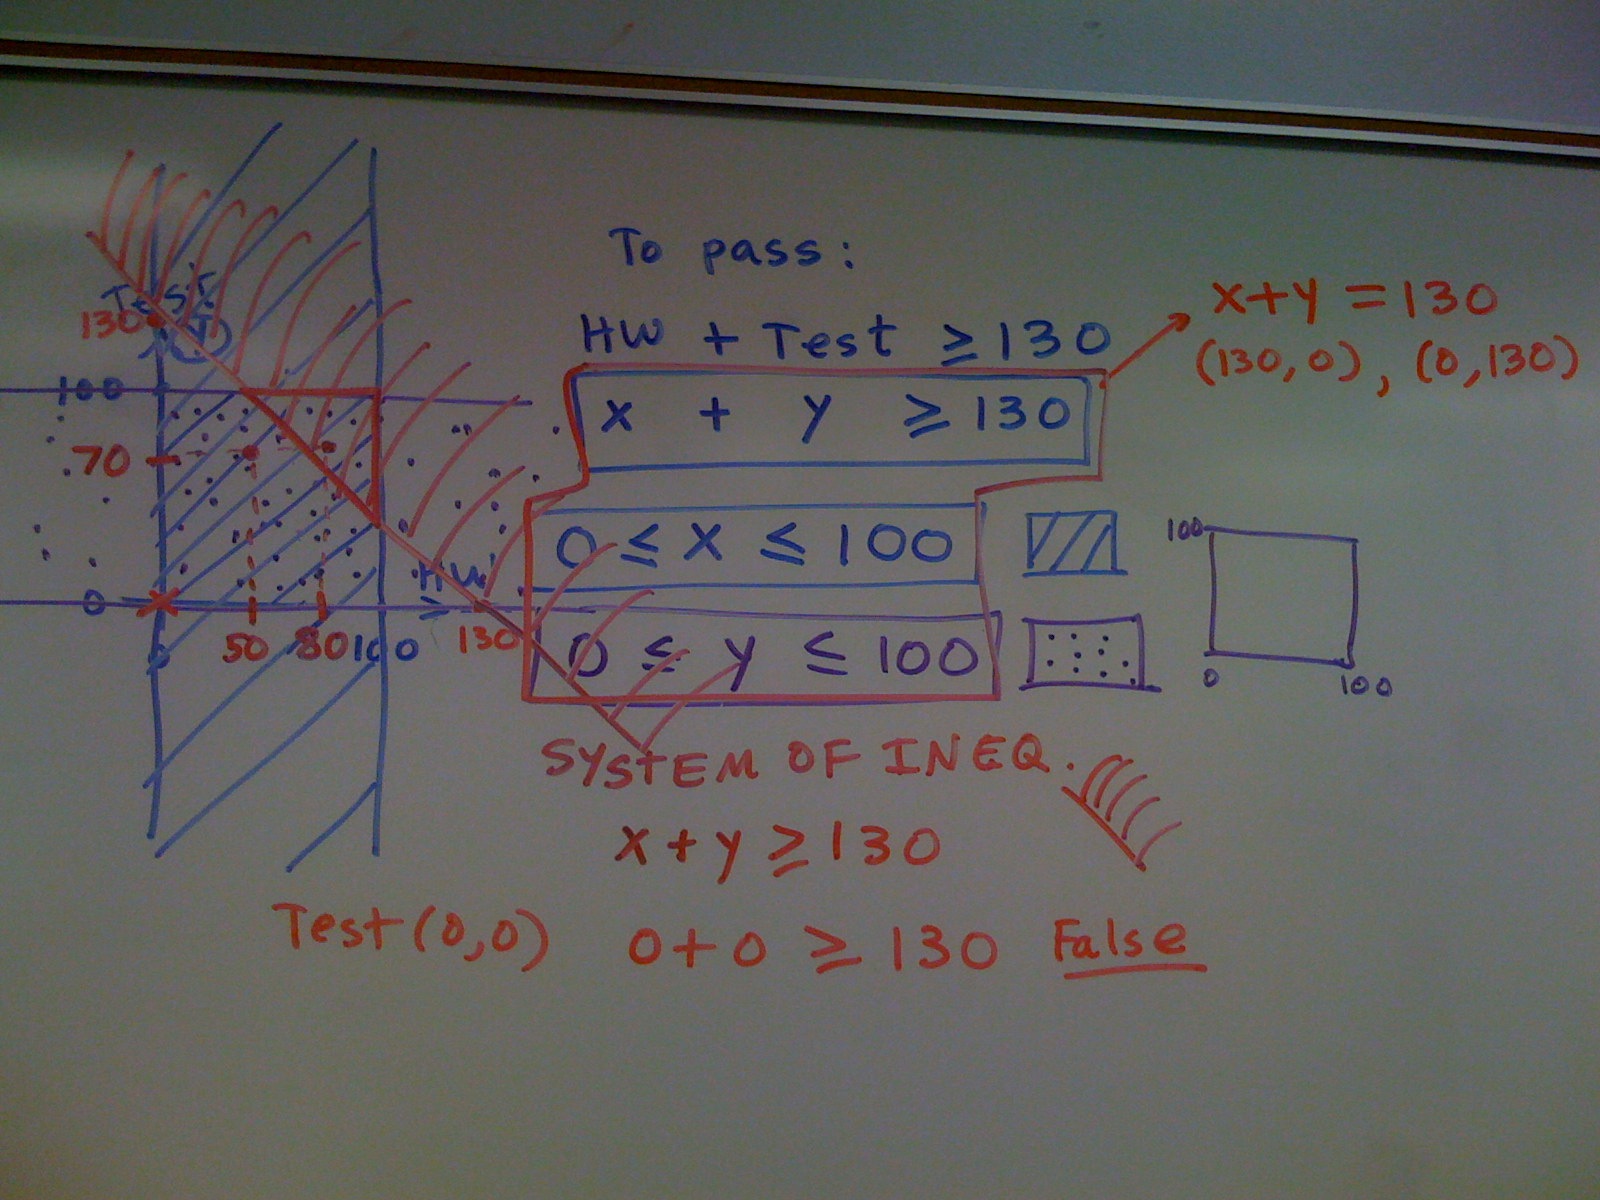
Addition of inequality.jpg - 16chseld 122

Gg-540Icon-10v2.gif - John Cummings

Princípio da desigualdade = Principo de malegaleco = Principle of inequality.jpg - François de Dijon
Winnie Byanyima - How do we tackle inequality- - At a glance.webm - Vanished Account Byeznhpyxeuztibuo

Inequality-adjusted human development index.svg - Isacdaavid
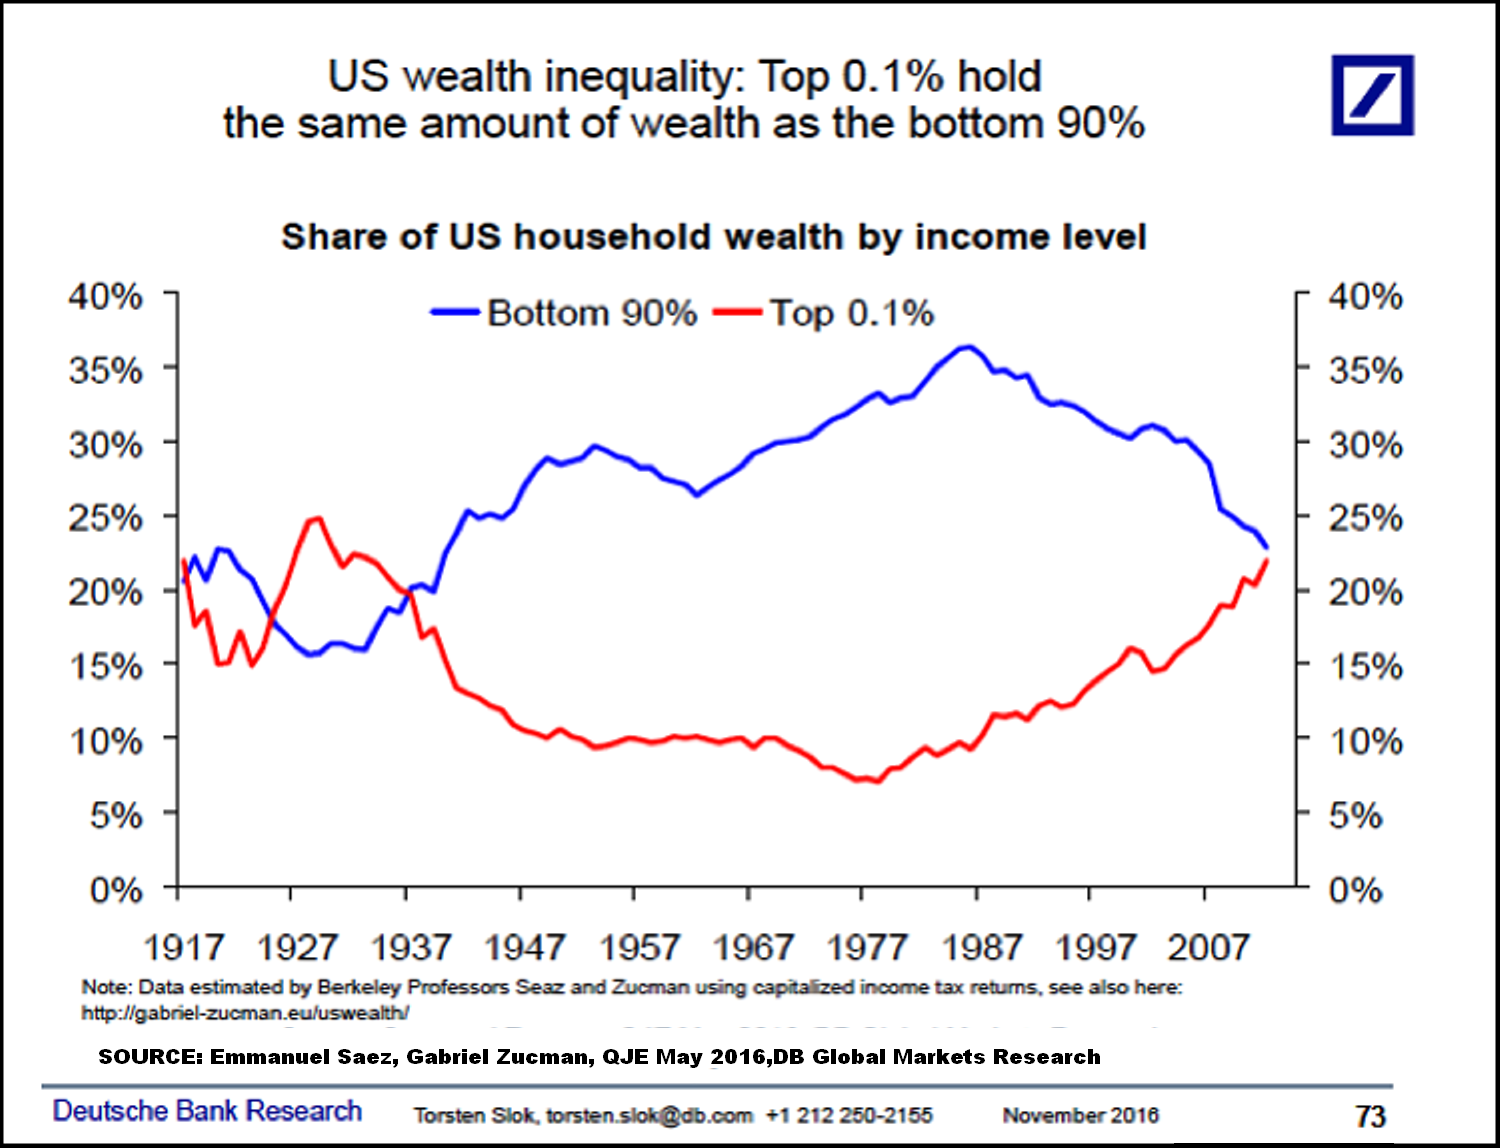
Epsilon-theory-ben-hunt-westworld-may-11-2017-graph-wealth-inequality.png - شہاب
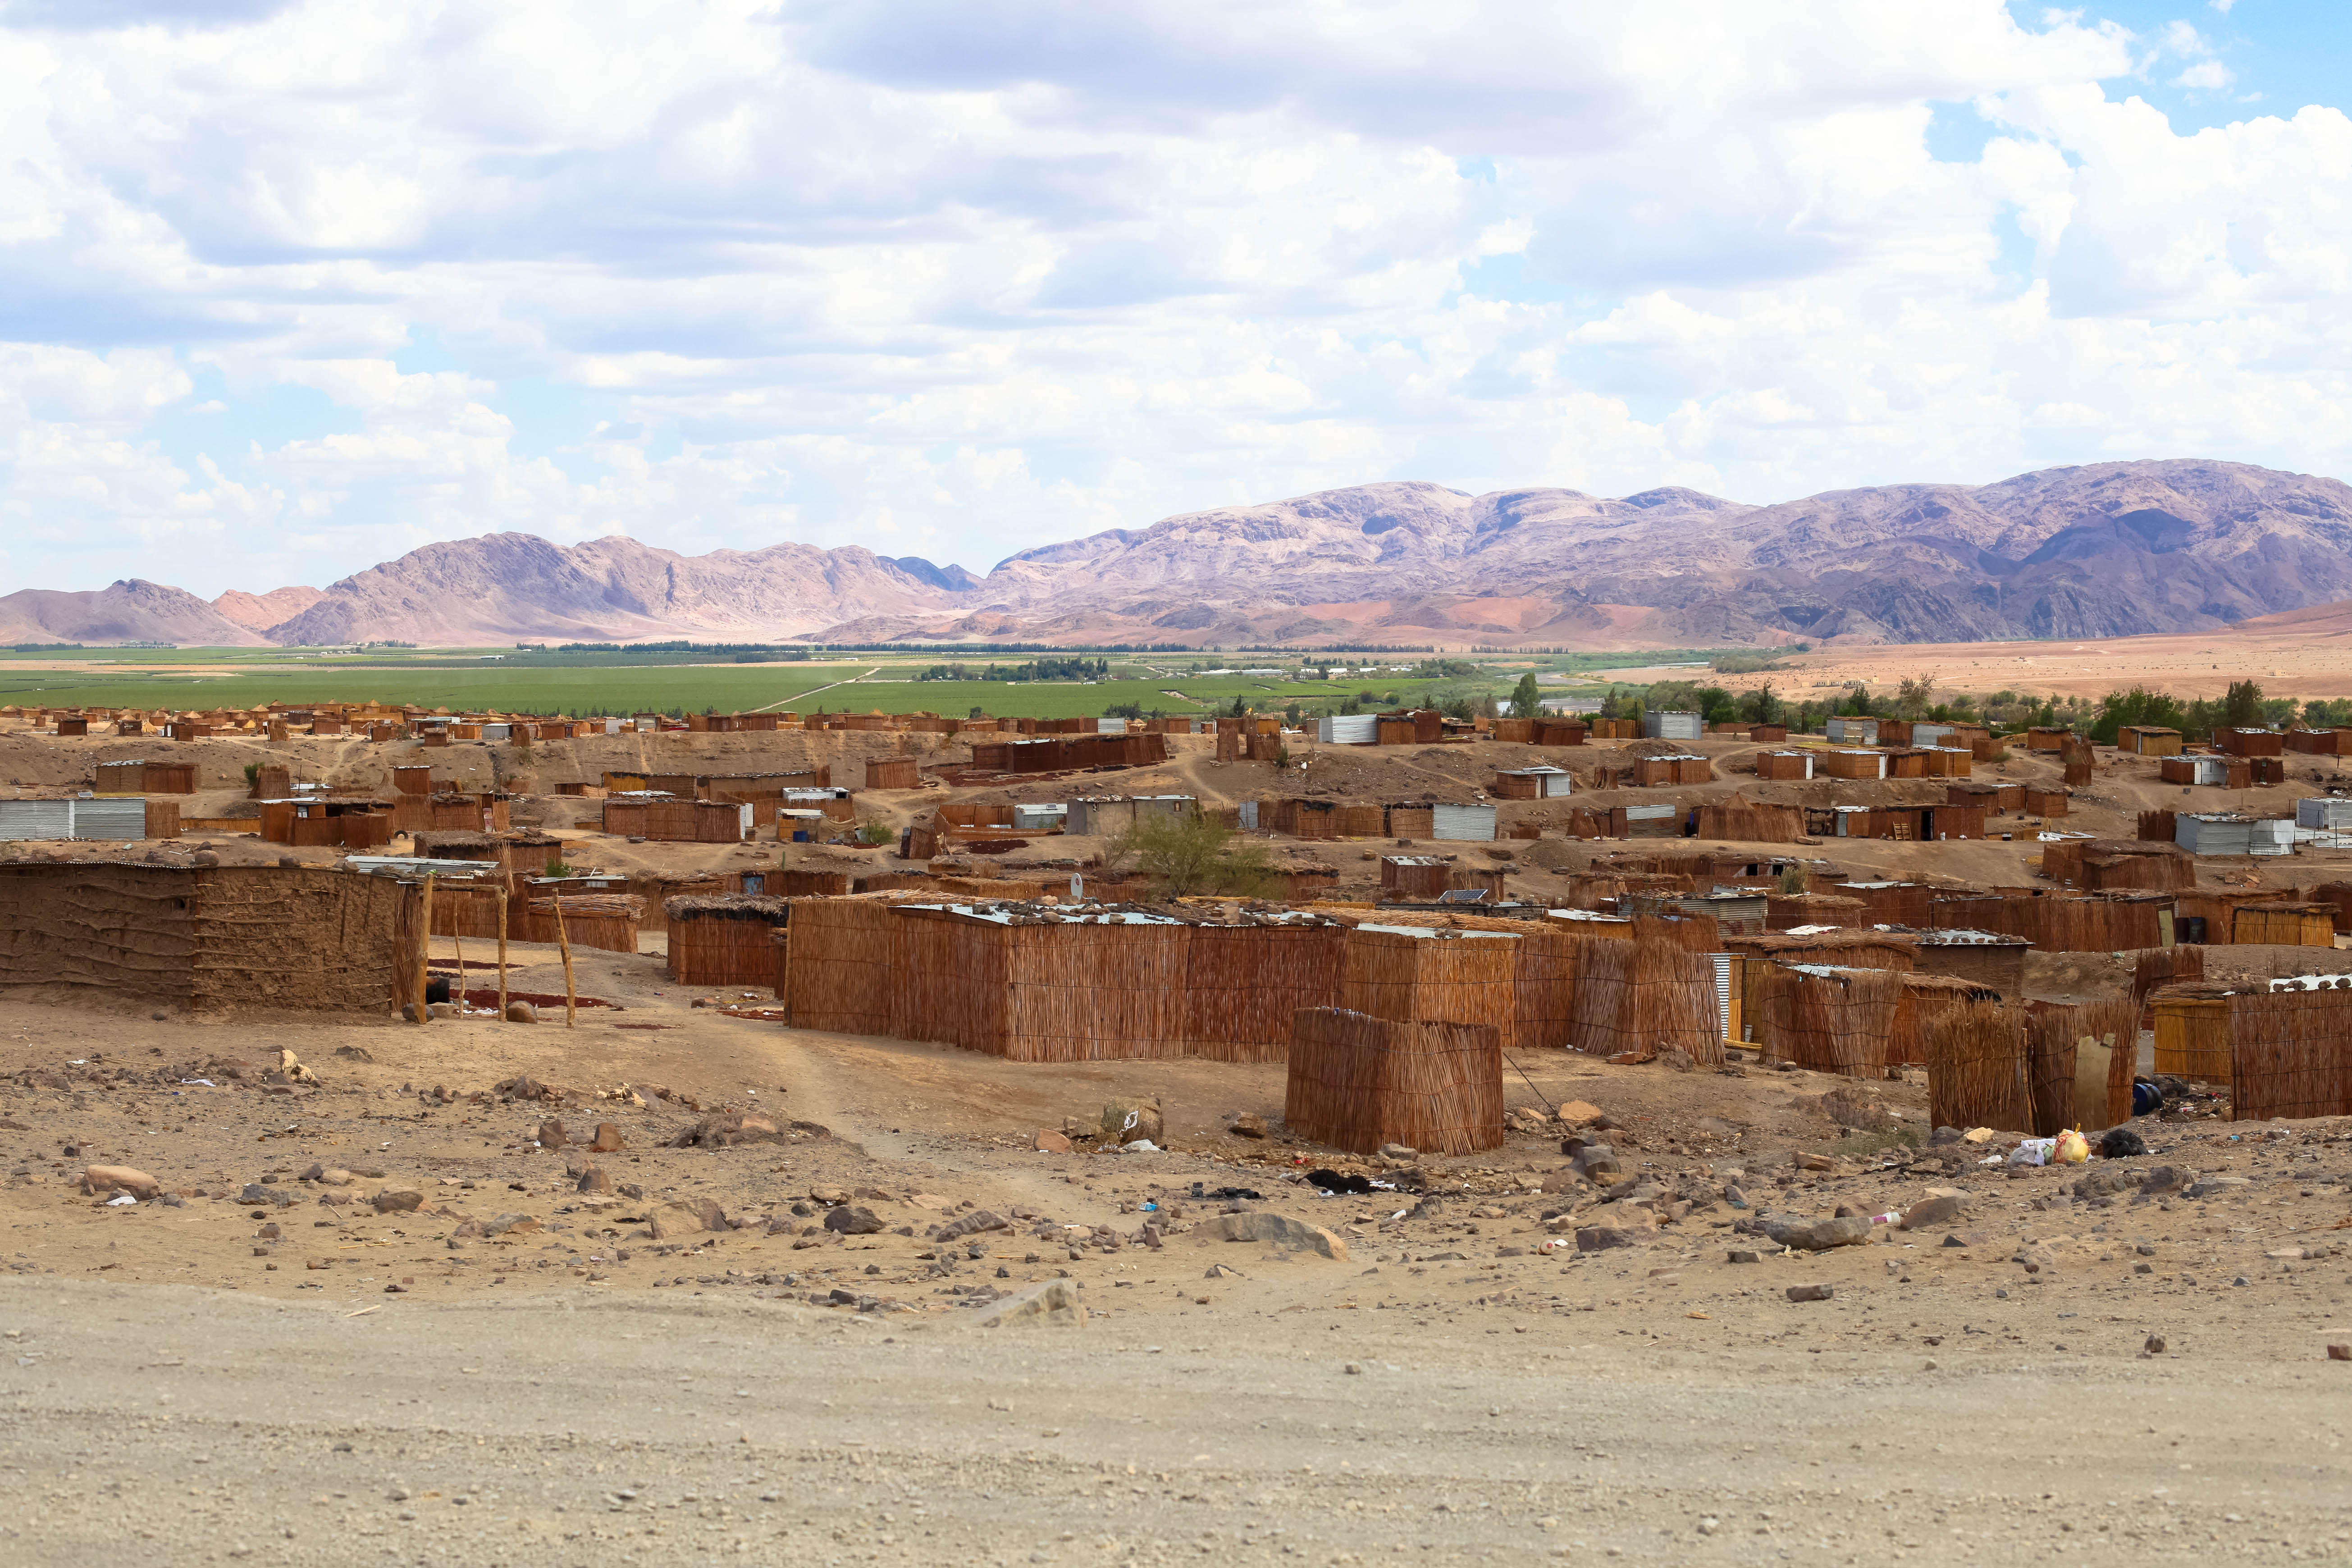
Aussenkehr.jpg - Chtrede

Interlomas desigualdades.jpg - Saul270998

2018 Inequality-Adjusted Human Development INdex.svg - Maketrad

Vicious circle illustration for my slides on machine learning ethics.svg - Syced

Pseudo-algorithm comparison for my slides on machine learning ethics.svg - Syced

GINI EU ITALY 2017.svg - Simon1104

Gini-Index France 2008-2017.svg - Loremipsum007

Gini index ireland 1995-2016.svg - Laschmi

Mean Median Income ES 2004-2017 EUSILC.svg - VWLteam

Mean Median Income ES 2004-2017 EUSILC True.svg - VWLteam

Map DispINC ES 2016 EUSILC.svg - VWLteam

Map DispINC PT 2016 EUSILC.svg - VWLteam

Map Poverty ES 2017 EUSILC.svg - VWLteam

Mean Median Income ES 2004-2017 EUSILC grey.svg - VWLteam

GINI Eurostat ES 2004-2017.svg - VWLteam

GINIB OECD ES 2004-2016.svg - VWLteam

GINI OECD ES 2004-2016.svg - VWLteam

Incquin ES 2004-2017 EUSILC.svg - VWLteam

Top10 ES 2004-2017.svg - VWLteam

Gender ES 2004-2017 EUSILC.svg - VWLteam

Genderpaygap ES 2007-2017 EUSILC.svg - VWLteam

Genderpaygap PT 2007-2017 EUSILC.svg - VWLteam

Mean Median Income PT 2004-2017 EUSILC.svg - VWLteam

Gender PT 2004-2017 EUSILC.svg - VWLteam

GINI Eurostat PT 2004-2017.svg - VWLteam

GINIboth OECD PT 2004-2016.svg - VWLteam

Incquin PT 2004-2017 EUSILC.svg - VWLteam

Top10 PT 2004-2017.svg - VWLteam

GINIboth OECD ES 2004-2016.svg - VWLteam

Map DispINC PT 2016 EUSILC neu.svg - VWLteam

Map DispINC PT 2016 EUSILC NEU.svg - VWLteam

Map Poverty ES 2017 EUSILC grey.svg - VWLteam

Map DispINC ES 2016 EUSILC grey.svg - VWLteam

Kisima Kaya a Pedestrian Village in Kenya.jpg - MichaelEArth
Launch of Oxfam Even it Up Campaign- Oxfam Ireland (2014).ogg - Darren J. Prior
Seoladh feachtas Even it Up- Oxfam Ireland 2014 (GA).ogg - Darren J. Prior

Union Vs inequality.png - Wikideas1

QM AM GM HM inequality visual proof.svg - Cmglee

Caries fluoride mouthrinse inequality.jpg - Sheiham3

20210818 Greenhouse gas emissions by income category - UN Emissions Gap Report.svg - Ainali

George John Pinwell - Landlord and Tenant - B2015.18.5 - Yale Center for British Art.jpg - SmartifyBot
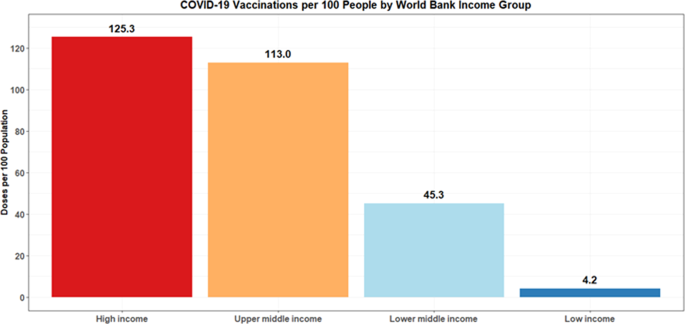
Covid 19 vaccination.png - Porubskt
If you rise, I fall - Equality is prevented by the misperception that it harms advantaged groups.pdf - Koavf

Inequality = conflict patch (5048834498).jpg - Victuallers
Air transport demand distribution in the USA.jpg - Prototyperspective

2021 CO2 emissions by income decile - International Energy Agency IEA.svg - RCraig09

2021 Carbon dioxide (CO2) emissions per person versus GDP per person - scatter plot.svg - RCraig09

Voetbal Gini - Nederland 2022-2023.png - KlaasVanGiersbergen
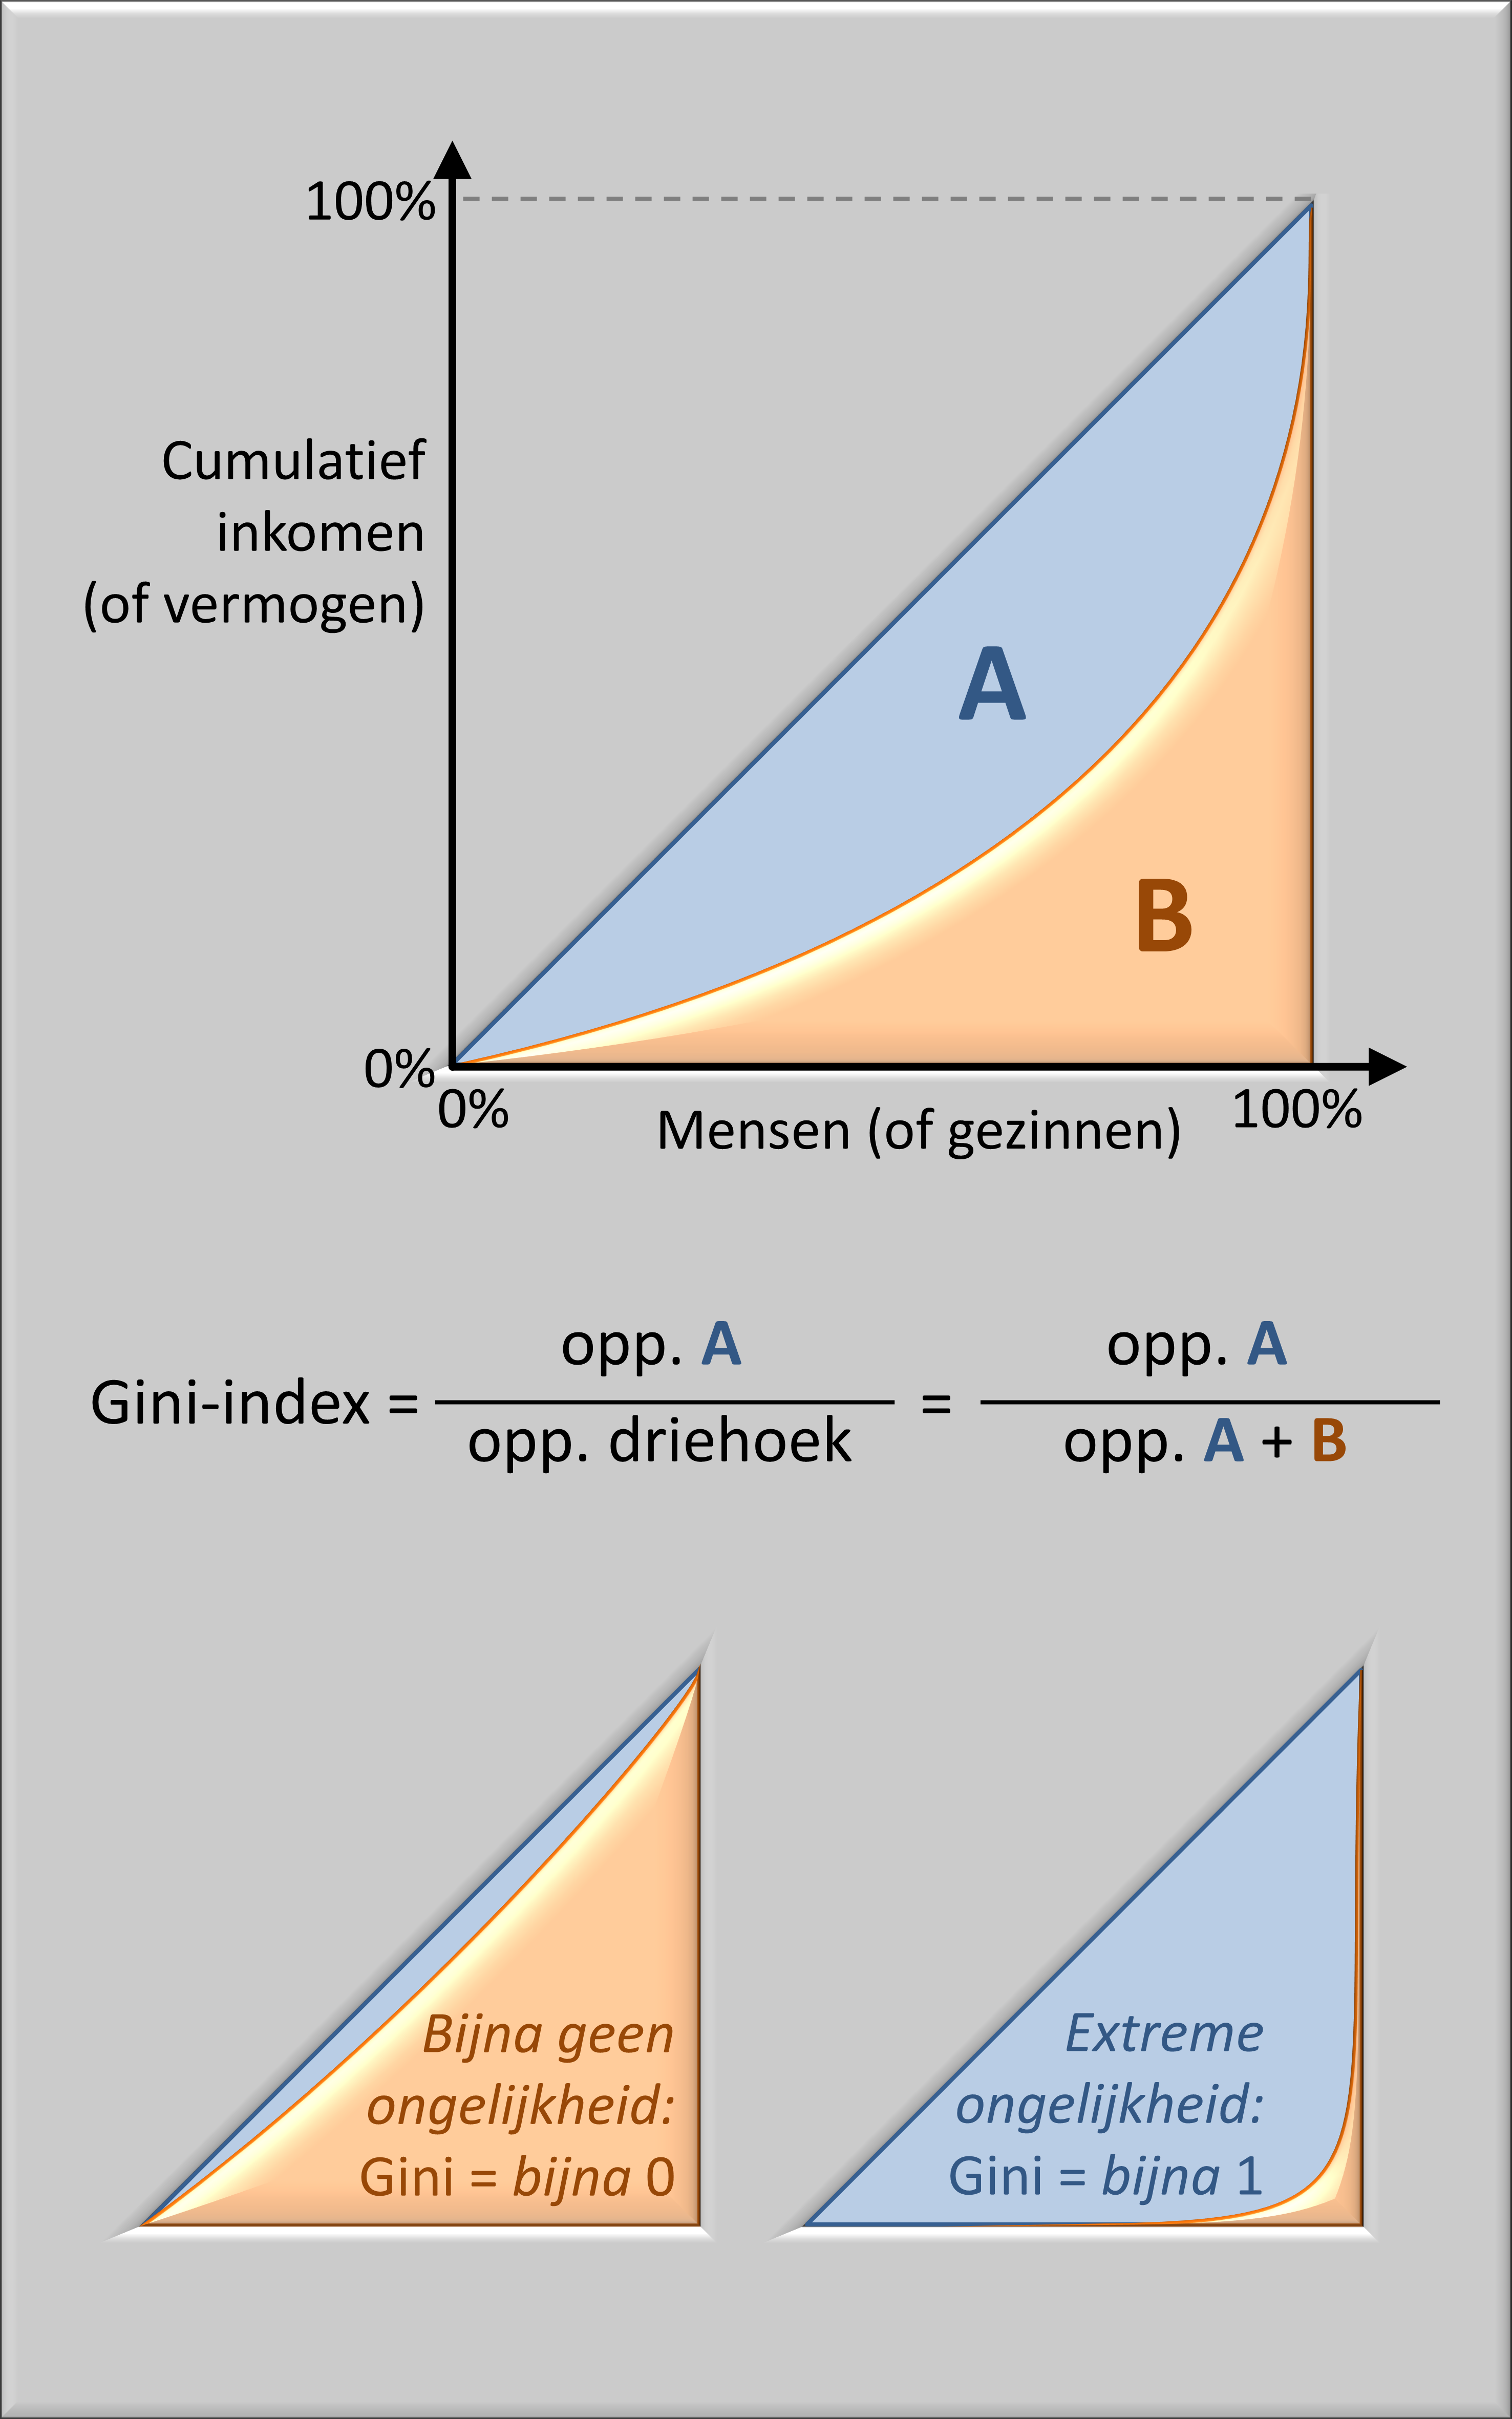
Gini-index (Nederlands).png - KlaasVanGiersbergen

Gini Index (English).png - KlaasVanGiersbergen

Voetbal Gini - UEFA 2022-2023.png - KlaasVanGiersbergen

Football Gini - Netherlands 2022-2023.png - KlaasVanGiersbergen

Football Gini - UEFA 2022-2023.png - KlaasVanGiersbergen

Voetbal Gini - Feedbacklussen.png - KlaasVanGiersbergen

Football Gini - Feedback Loops.png - KlaasVanGiersbergen

Shirin Sharmin Chaudhury in Aid for Gender Equality (11433083255) (cropped).jpg - Fritzober

Mean household t CO2e emissions (2019) per income group under the pre-tax supplier framework.png - Prototyperspective

2019 Carbon dioxide emissions by income group - Oxfam data.svg - RCraig09

PropriétéRepartitionFrance1780-2015.png - Médicis

Inégalités de revenu dans le monde, 2021.png - Médicis

Inégalités de revenu dans le monde en 2021.png - Médicis

Evolution des inégalités de revenu dans le monde de 1820 à 2020.png - Médicis

Chiffres de Joseph Caillaux.png - Médicis

Répartition du patrimoine en France en 1909 par catégories.png - Médicis

Evolution des écarts de salaire entre les hommes et les femmes dans le secteur privé en France, 1995-2022.png - Médicis

Global map of high inequality countries, 2022.png - Florin Talasman
Thom Hartmann on The Hidden History of the American Dream.ogg - DavidMCEddy
Thom Hartmann on The Hidden History of the American Dream.webm - DavidMCEddy