Wikimedi'Òc
Modes d'emploi

Cet album fait partie des albums
Cet album photos contient les sous-albums suivants :


Disease burden from communicable, maternal, neonatal and nutritional diseases by age, OWID.svg - Fæ

Disease burden from non-communicable diseases by age, OWID.svg - Fæ

Prevalence of cancer by age, OWID.svg - Fæ

Cardiovascular disease death rates by age, OWID.svg - Fæ

Deaths from cardiovascular diseases, by age, OWID.svg - Fæ

Deaths from protein-energy malnutrition, by age, OWID.svg - Fæ

Prevalence of depression by age, OWID.svg - Fæ

Number of conditions ever recorded per individual (from 308 health conditions), stratified by age, sex, and ethnicity.jpg - Prototyperspective
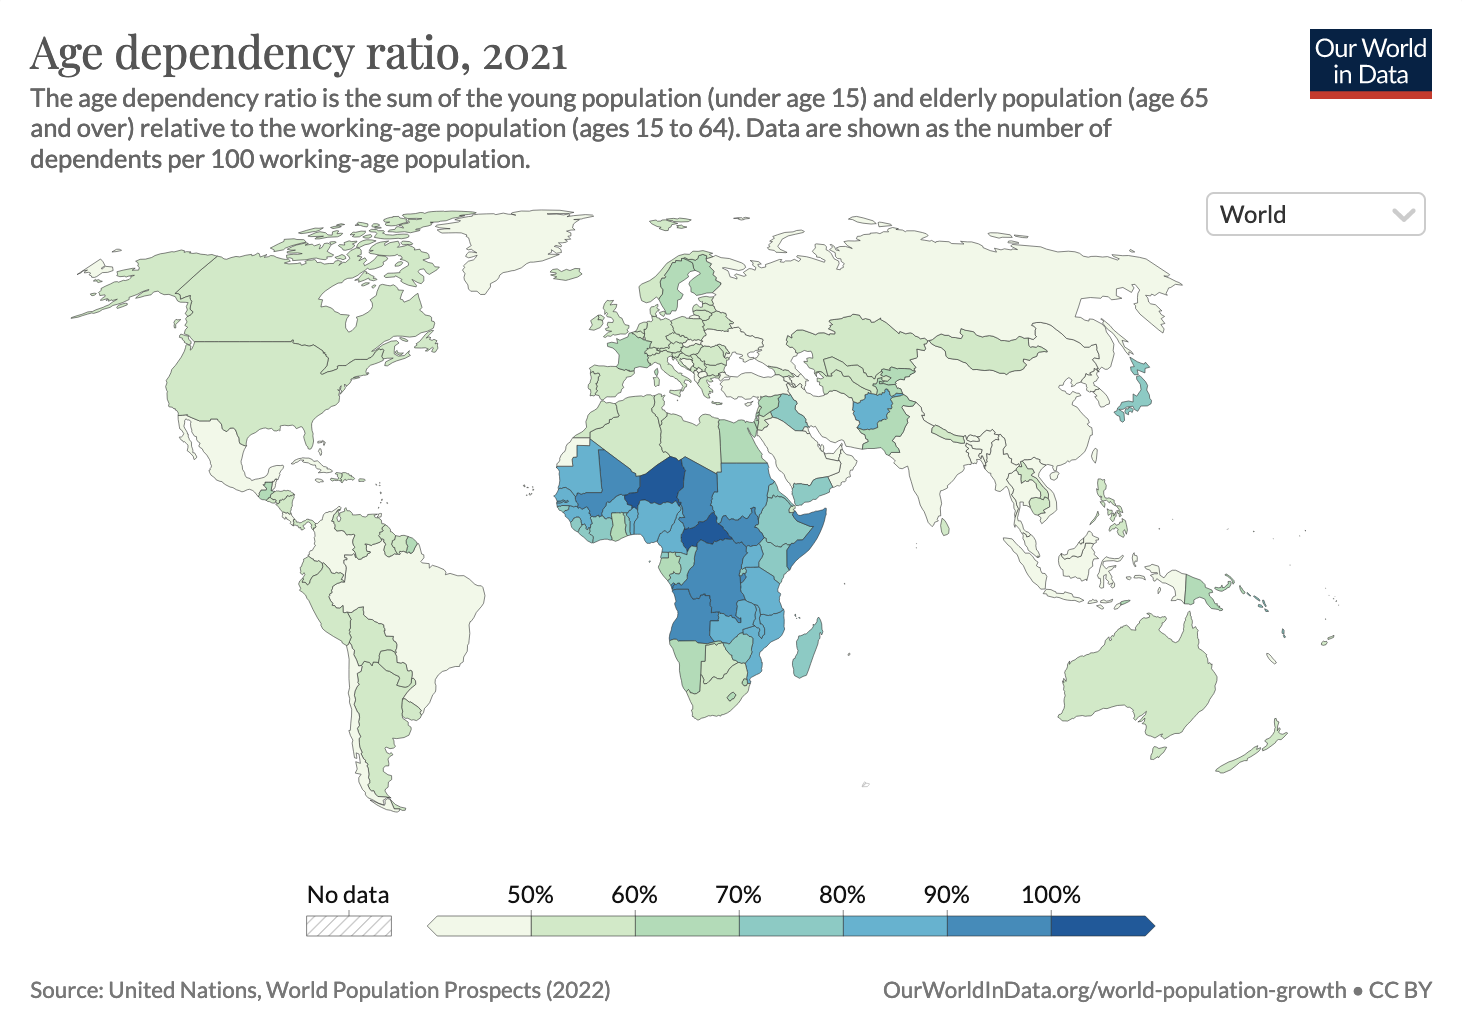
Age Dependency Ratio, 2021.png - SamuelSThomas

Air-pollution-deaths-by-age (OWID 0074).png - Jason.nlw

Hiv-death-rates-by-age.png - Ozzie10aaaa

Prevalence-of-alcohol-use-disorders-by-age.png - Ozzie10aaaa

Stroke-deaths-by-age (1).png - Ozzie10aaaa

Respiratory-disease-deaths-by-age.png - Ozzie10aaaa
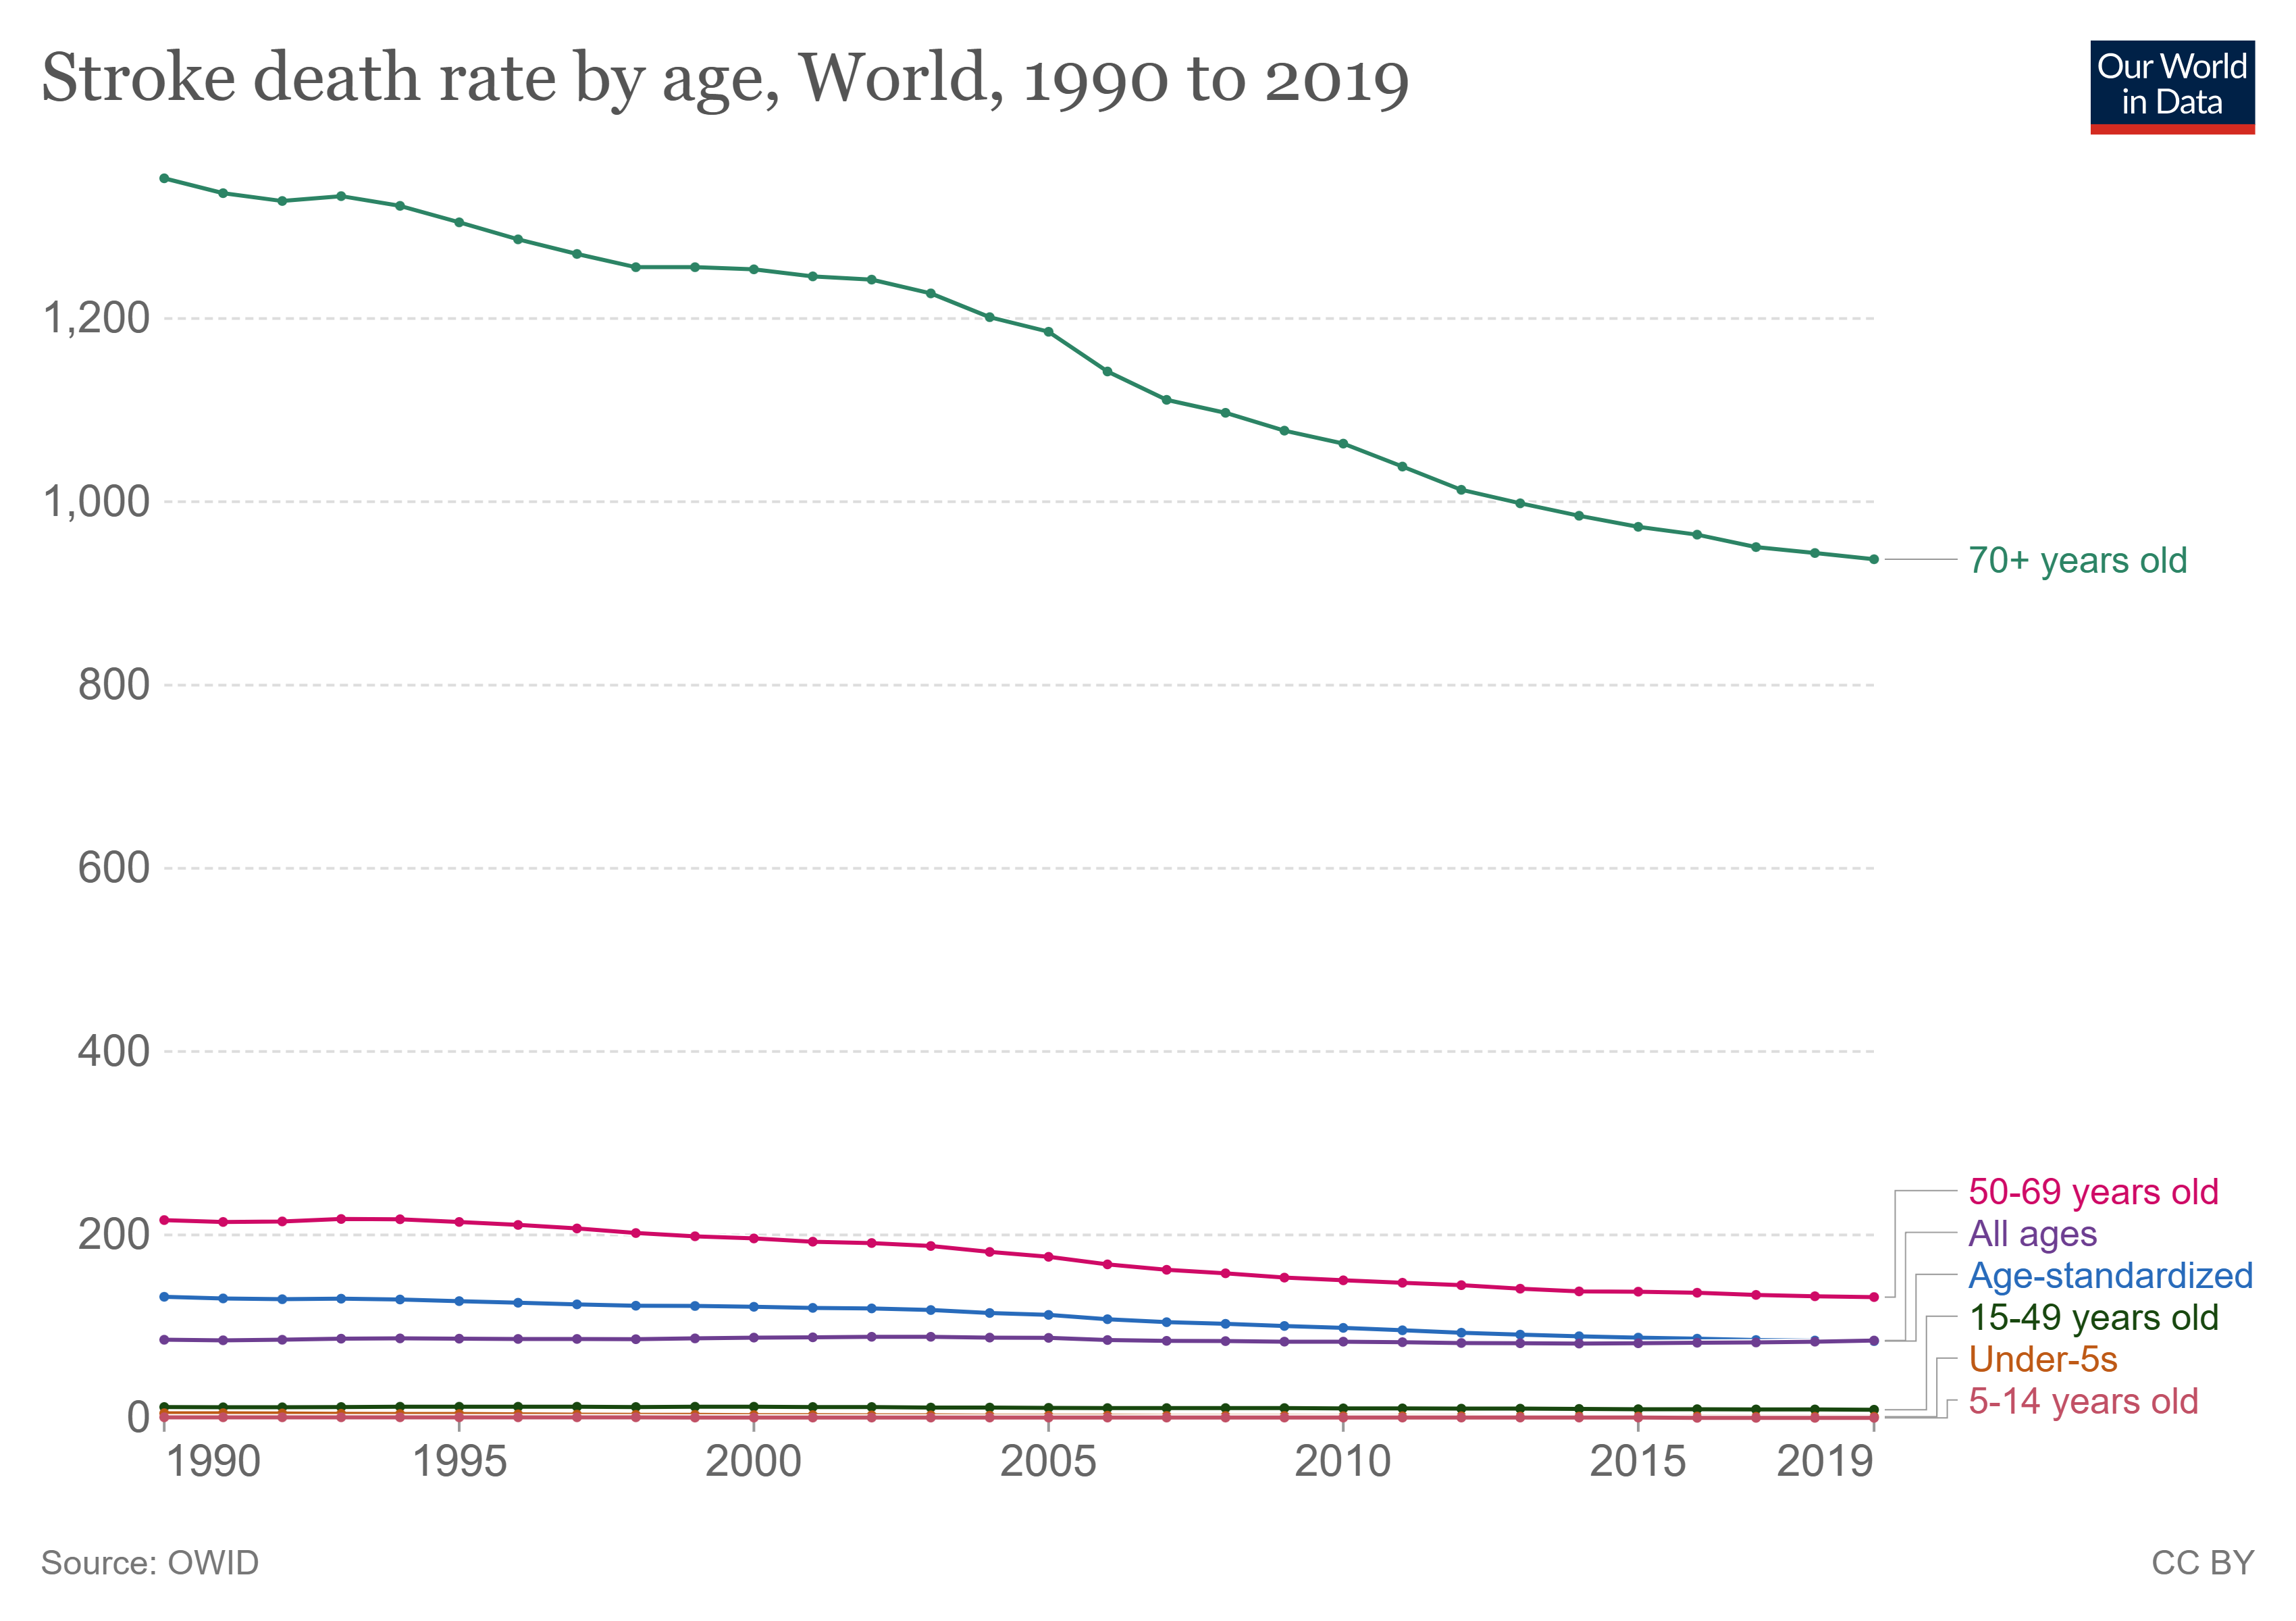
Stroke-death-rates-by-age.png - Ozzie10aaaa

Leading 25 Level 3 causes of global DALYs and percentage of total DALYs (1990 and 2019), and percentage change in number of DALYs and age-standardised DALY rates from 1990 to 2019 (3).jpg - Prototyperspective

Leading 25 Level 3 causes of global DALYs and percentage of total DALYs (1990 and 2019), and percentage change in number of DALYs and age-standardised DALY rates from 1990 to 2019 (2).jpg - Prototyperspective

Leading 25 Level 3 causes of global DALYs and percentage of total DALYs (1990 and 2019), and percentage change in number of DALYs and age-standardised DALY rates from 1990 to 2019.jpg - Prototyperspective

Number-of-people-with-cancer-by-age.png - Ozzie10aaaa

Deaths-from-hiv.png - Ozzie10aaaa