Wikimedi'Òc
Modes d'emploi

Cet album fait partie des albums


Rest-Budget.jpg - Albrecht62

Global carbon cycle.png - Florin Talasman

Anthropogenic carbon flows – Cumulative changes over the 1850–2022 period (a) and average fluxes over the 2013–2022 period (b) for the anthropogenic perturbation of the global carbon cycle.png - Prototyperspective

Kaya decomposition of the main drivers of fossil CO2 emissions, considering population, GDP per person, energy per GDP, and CO2 emissions per energy unit.png - Prototyperspective

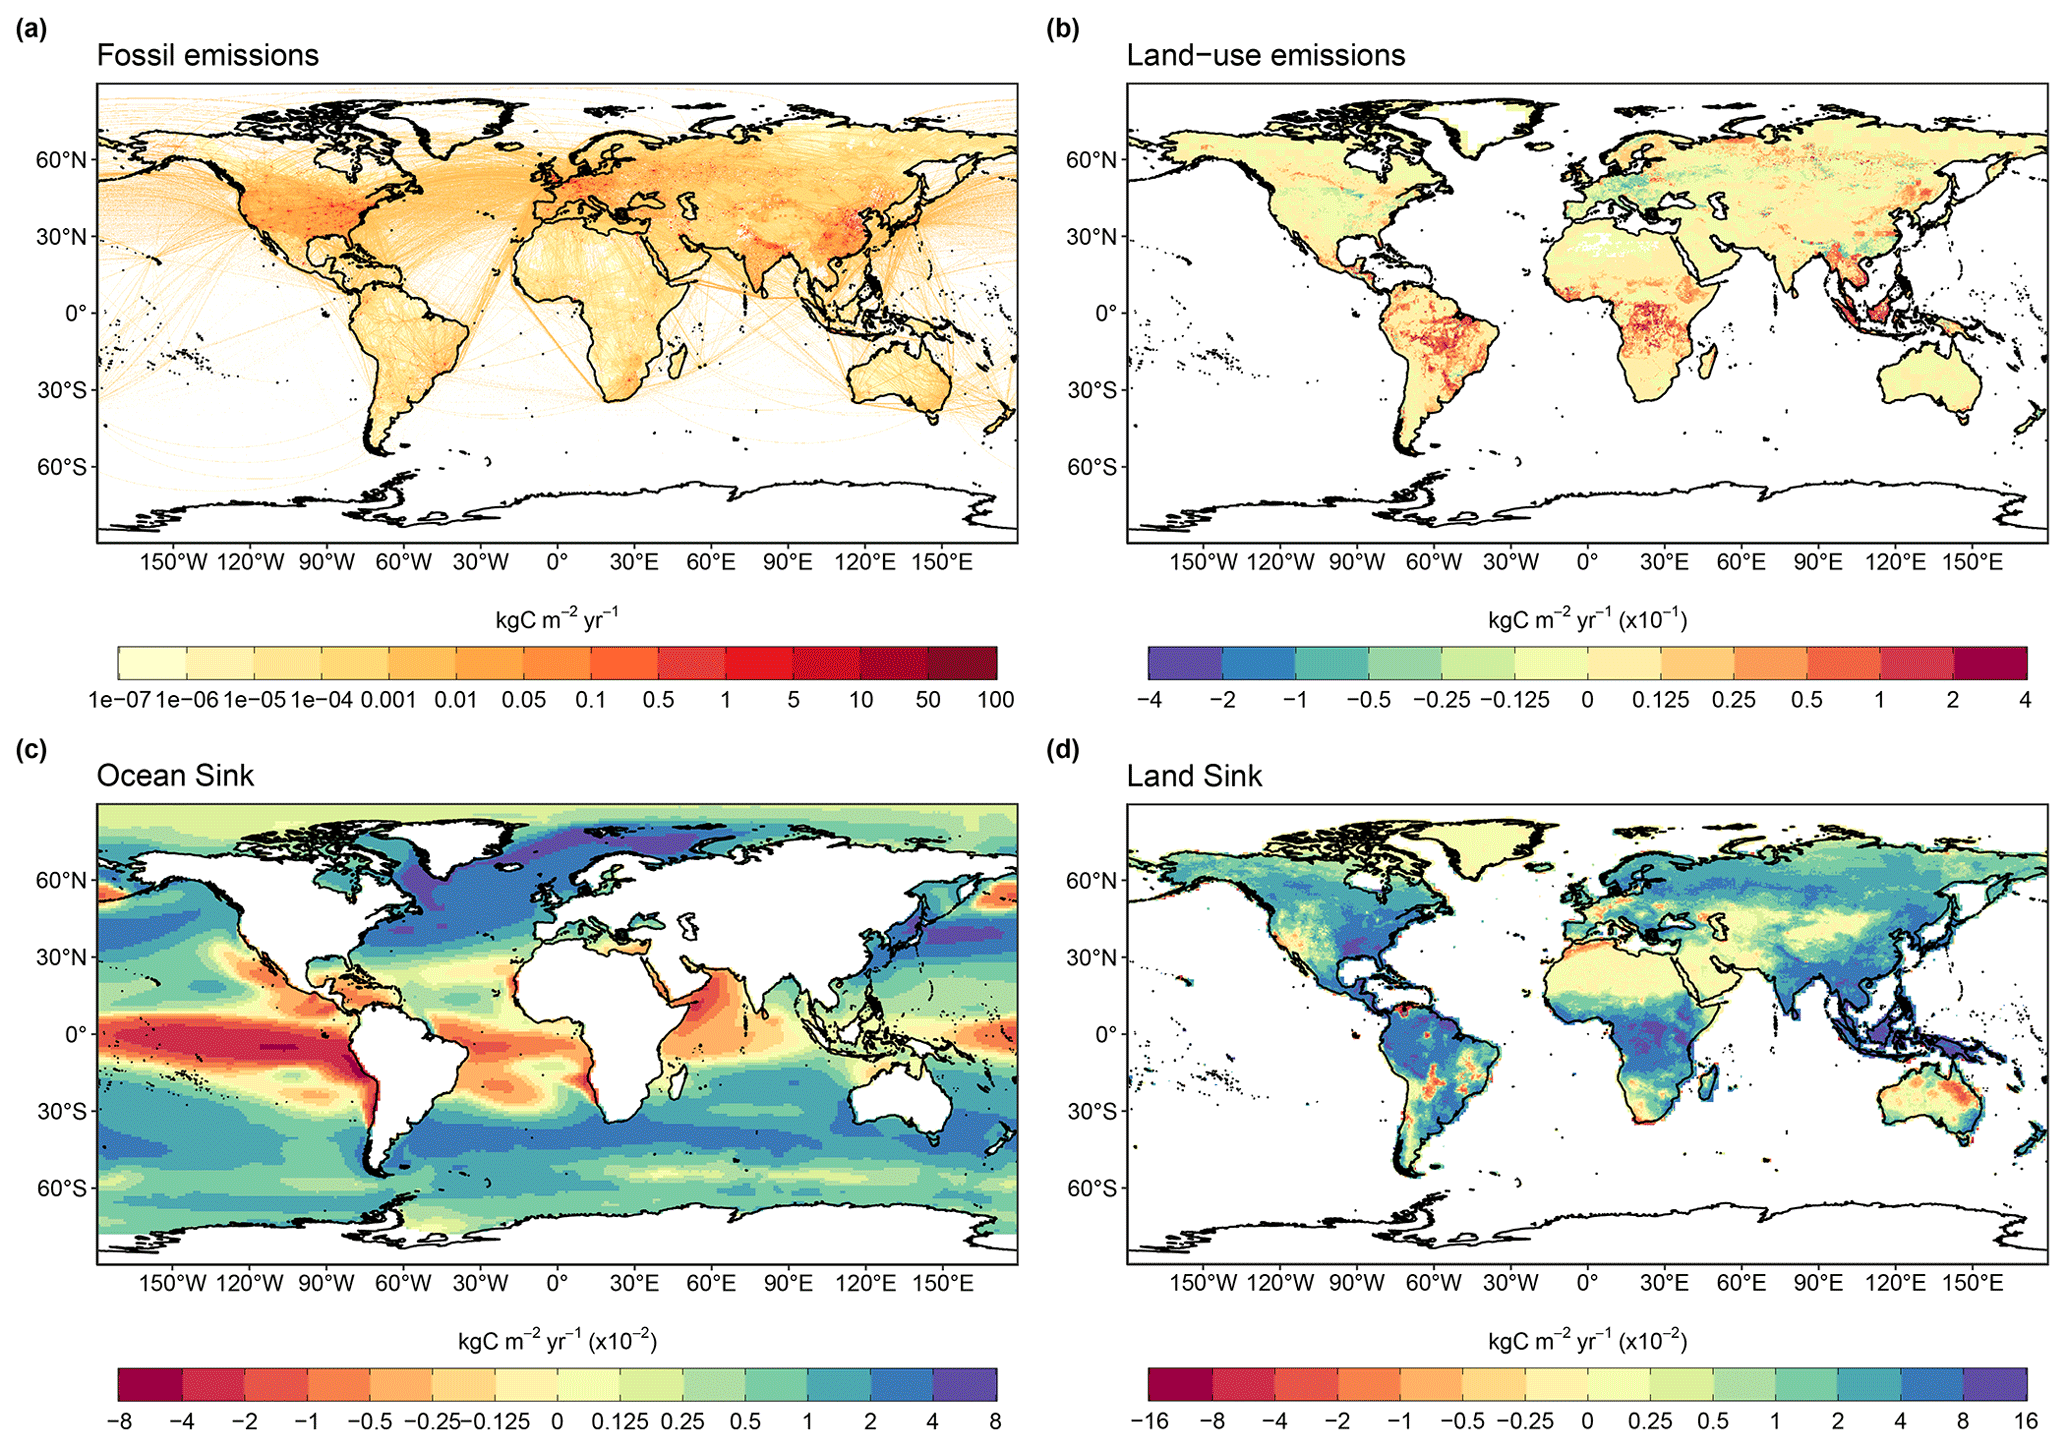
Major known sources of uncertainties in each component of the global carbon budget, defined as input data or processes that have a demonstrated effect of at least ±0.3 Gt C yr−1.png - Prototyperspective

Decadal mean (a) land and (b) ocean fluxes for RECCAP-2 regions over 2013–2022.png - Prototyperspective

The 2013–2022 decadal mean global net atmosphere–ocean and atmosphere–land fluxes.png - Prototyperspective

CO2 fluxes between the atmosphere and the Earth's surface separated between land and oceans, globally and in three latitude bands.png - Prototyperspective

The partitioning of total anthropogenic CO2 emissions across environmental domains.png - Prototyperspective

Attribution of the atmosphere–ocean (SOCEAN) and atmosphere–land (SLAND) CO2 fluxes to (a) increasing atmospheric CO2 concentrations and (b) changes in climate, averaged over the previous decade 2013–2022.png - Prototyperspective

Comparison of the anthropogenic atmosphere–ocean CO2 flux.png - Prototyperspective

Comparison of results from the bookkeeping method and budget residuals with results from the DGVMs, as well as additional estimates from ESMs.png - Prototyperspective

The land CO2 sink and net atmosphere–land CO2 fluxes.png - Prototyperspective

Net CO2 exchanges between the atmosphere and the terrestrial biosphere related to land-use change.png - Prototyperspective
The 2013–2022 decadal mean components of the global carbon budget.png - Prototyperspective

Fossil CO2 emissions by source of continued CO2 rise.png - Prototyperspective

Components of the global carbon budget and their uncertainties as a function of time.png - Prototyperspective

Combined components of the global carbon budget as a function of time.png - Prototyperspective

Surface average atmospheric CO2 concentration (ppm) 1980–2022.png - Prototyperspective

Schematic representation of the overall perturbation of the global carbon cycle caused by anthropogenic activities, averaged globally for the decade 2013–2022.png - Prototyperspective

Globalcarbonbudget 2023.jpg - Lupe
Global Carbon Budget, 2023 (SVS31270 - historical carbon budget bars scaled y 2023).webm - OptimusPrimeBot
Global Carbon Budget, 2023 (SVS31270 - historical carbon budget bar chart 2023).webm - OptimusPrimeBot
Global Carbon Budget, 2023 (SVS31270 - historical carbon budget bar chart v4 2160p10).webm - OptimusPrimeBot

Annual CO2 emissions per country, 2022.png - Florin Talasman