Wikimedi'Òc
Modes d'emploi

Cet album fait partie des albums
Cet album photos contient les sous-albums suivants :


Average standard alcoholic drinks consumed per day in 2016, age-standardised.jpg - Doc James

Age-standardised prevalence of current alcohol drinking in 2016.jpg - Doc James

Total number of deaths by age globally for both sexes combined 1950–2017.png - Millencolin

Cancer death rates by type, OWID.svg - Fæ

Percentage change of risk-attributable cancer DALY counts and age-standardised DALY rates for Level 1 risk factors by SDI quintile, both sexes combined, 2010–19.jpg - Prototyperspective

Estimates of age-specific rates of risk-attributable cancer DALYs, SDI quintiles, both sexes combined, 2019.jpg - Prototyperspective

Leading risk factors at the most detailed level for risk-attributable cancer age-standardised DALY rates globally, both sexes combined, 2010–19.jpg - Prototyperspective

Global map of age-standardised DALY rate quintiles for risk-attributable cancer burden, both sexes combined, 2019; 2of2.jpg - Prototyperspective

Global map of age-standardised DALY rate quintiles for risk-attributable cancer burden, both sexes combined, 2019; 1of2.jpg - Prototyperspective

Global deaths from cancers attributable to risk factors in 2019 by sex and SDI.jpg - Prototyperspective

Cancer DALYs attributable to 11 Level 2 risk factors globally in 2019.jpg - Prototyperspective

Global number of deaths, by pathogen, age, and sex groups, 2019.jpg - Prototyperspective

Global number of deaths (A) and YLLs (B), by pathogen and GBD super-region, 2019.jpg - Prototyperspective

Overall age-standardised mortality rate per 100 000 population for 33 pathogens investigated, 2019.jpg - Prototyperspective

Global number of deaths (A) and YLLs (B), by pathogen and infectious syndrome, 2019.jpg - Prototyperspective

Pathogen responsible for the highest age-standardised mortality rate per 100 000 population (A) and for the highest age-standardised YLL rate per 100 000 population (B), for each country or territory, 2019.jpg - Prototyperspective

Change from 1990 to 2021 in population attributable fraction for high BMI in relation to type 2 diabetes, by GBD super-region.jpg - Prototyperspective

Prevalence of total diabetes by age and GBD super-region in 2021.jpg - Prototyperspective

Global age-standardised prevalence of type 1 and type 2 diabetes from 1990 through 2050 forecasts.jpg - Prototyperspective

Age-standardised total diabetes prevalence rates in 2021.jpg - Prototyperspective
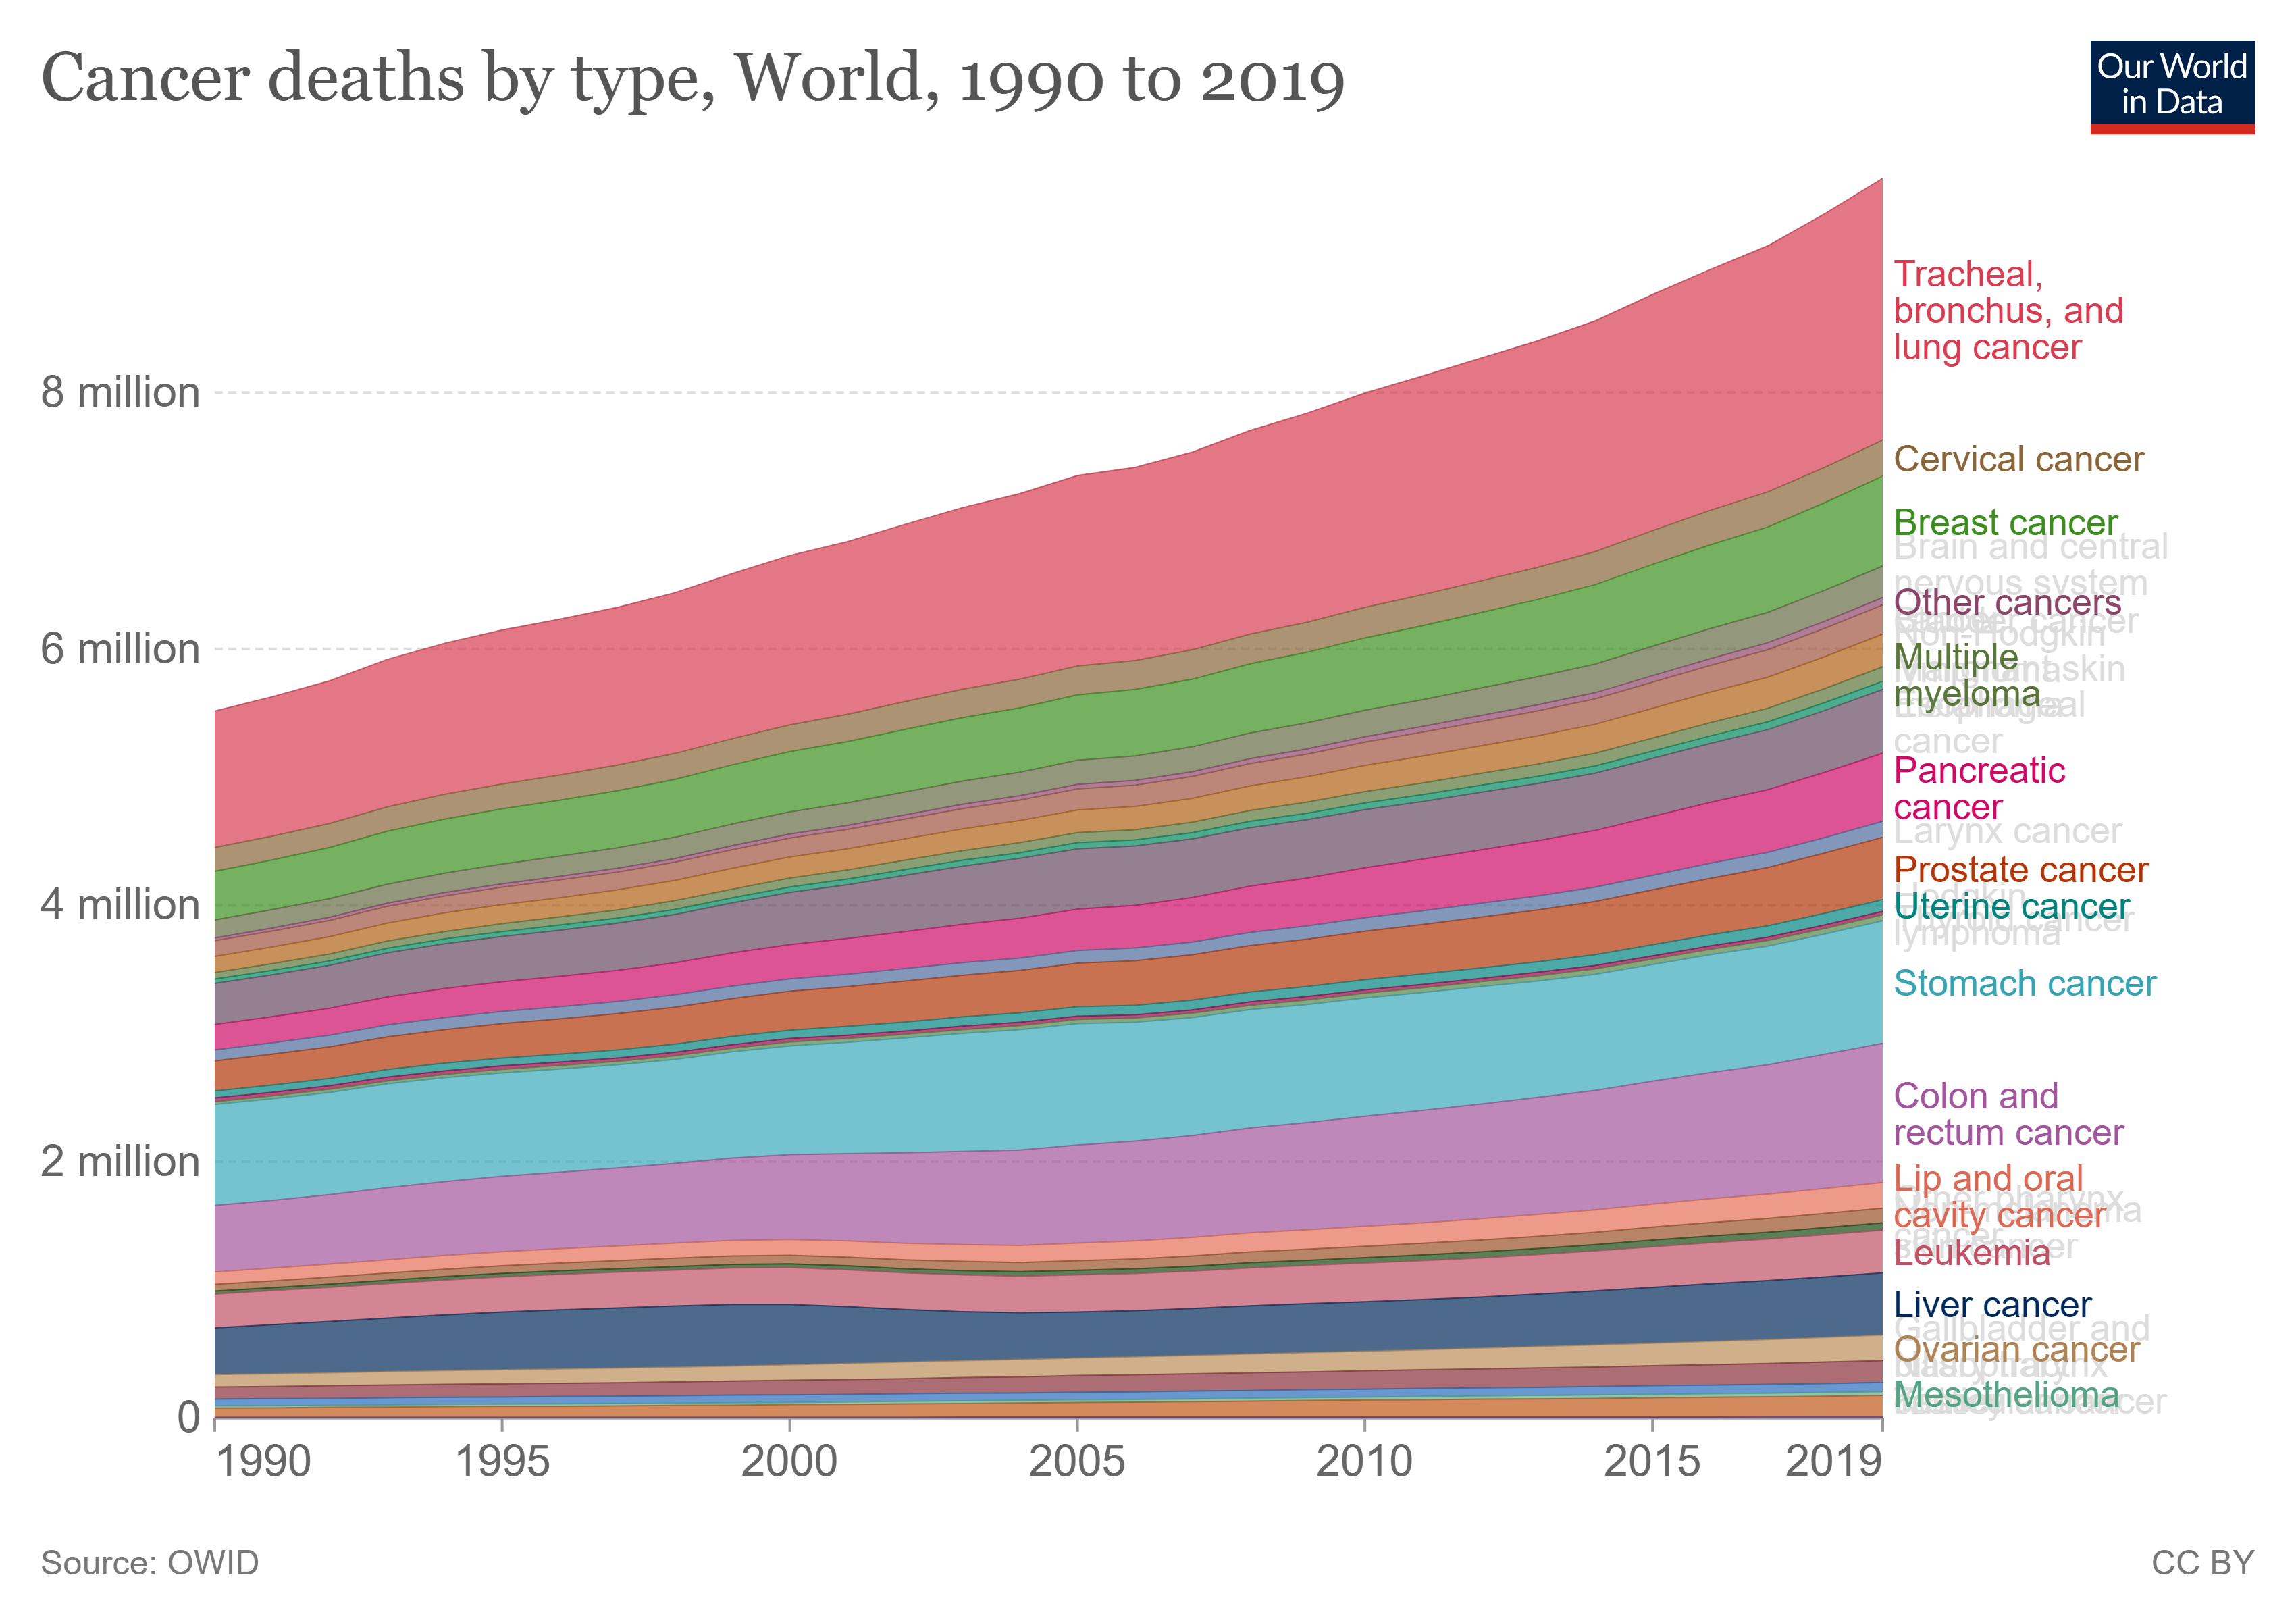
Cancer-deaths-by-type.png - Ozzie10aaaa

Total fertility rate, globally and by GBD super-region, 1950–2100.jpg - Prototyperspective

Global number of years of potential life lost, by pathogen and infectious syndrome, 2019.jpg - Prototyperspective