Wikimedi'Òc
Modes d'emploi

Cet album fait partie des albums


Migraciones humanas en haplogrupos mitocondriales.PNG - Maulucioni

Haplogroup X (mtDNA).PNG - Maulucioni

Most-of-the-extant-mtDNA-boundaries-in-South-and-Southwest-Asia-were-likely-shaped-during-the-1471-2156-5-26-11.jpg - Recitation-bot

Most-of-the-extant-mtDNA-boundaries-in-South-and-Southwest-Asia-were-likely-shaped-during-the-1471-2156-5-26-2.jpg - Recitation-bot

Most-of-the-extant-mtDNA-boundaries-in-South-and-Southwest-Asia-were-likely-shaped-during-the-1471-2156-5-26-3.jpg - Recitation-bot

Most-of-the-extant-mtDNA-boundaries-in-South-and-Southwest-Asia-were-likely-shaped-during-the-1471-2156-5-26-1.jpg - Recitation-bot
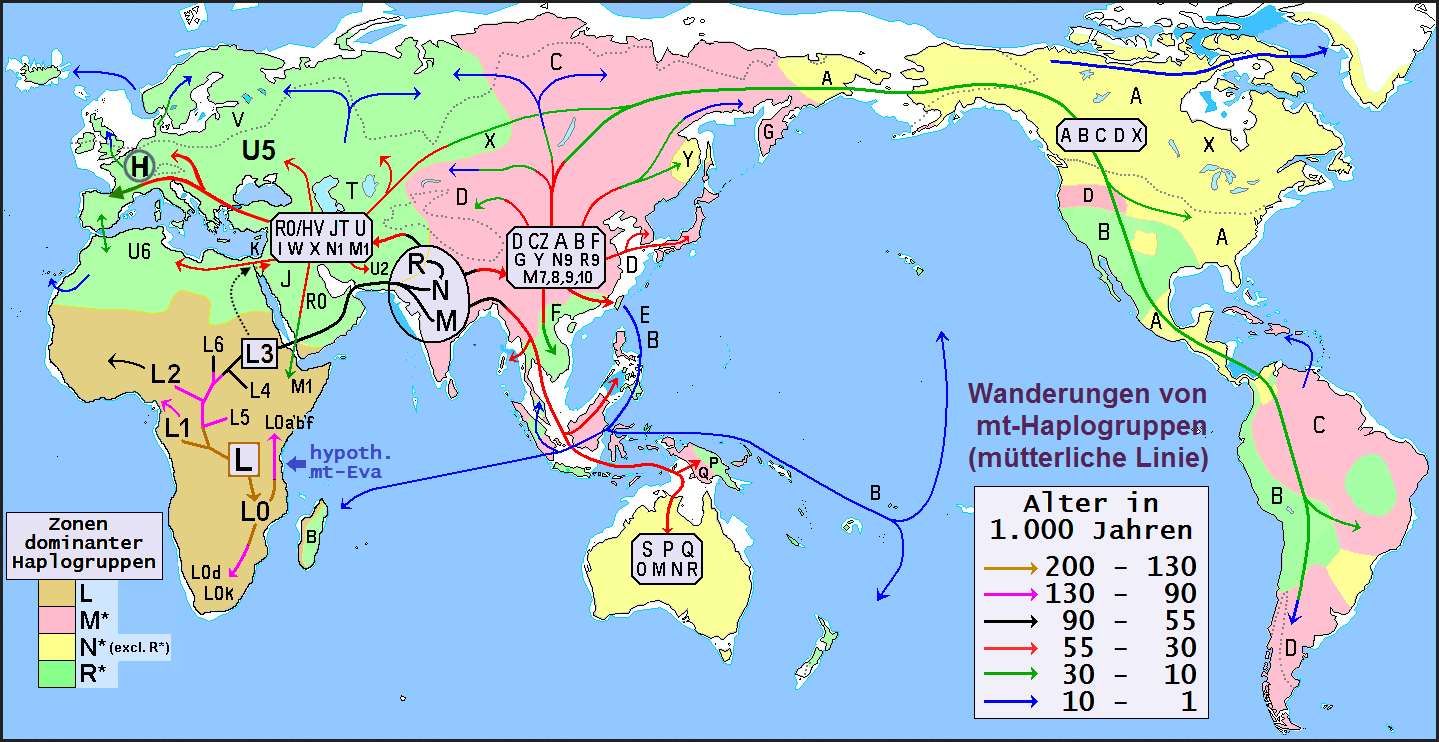
Mt-Haplogruppen-Wanderung.png - Juschki

Haplo-mt-Europa.png - Juschki

Frequency maps based on HVS-I data for haplogroups L0, L0a, L0b, L0d, L0f and L0k.png - Was a bee

Frequency maps based on HVS-I data for haplogroups L0 (total).png - Was a bee

Interpolation maps for L0 haplogroup.jpg - Was a bee

Interpolation maps for L0 haplogroup total.png - Was a bee

Interpolation maps for L1 haplogroup.jpg - Was a bee

Interpolation maps for L1 haplogroup total.png - Was a bee
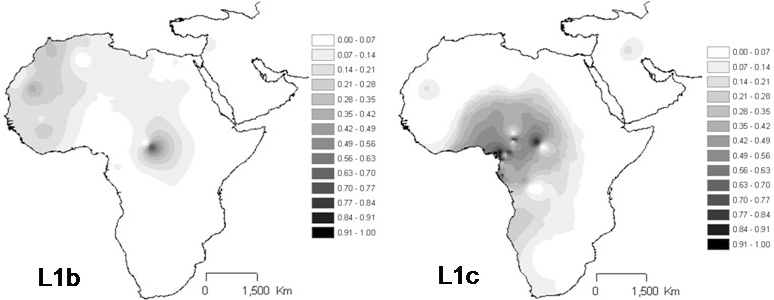
Interpolation maps for haplogroup L1b and L1c.png - Was a bee

Interpolation maps for L2 haplogroup.jpg - Was a bee

Interpolation maps for L2 haplogroup total.png - Was a bee

Interpolation maps for L3 total haplogroups.png - Was a bee

Interpolation maps for L3b, L3d, L3e, L3f L3h, L3i, L3x and L3w haplogroups.png - Was a bee
Frequency distribution maps for mtDNA haplogroup L2.jpg - Was a bee

MtDNA haplogroup tree and distribution map.gif - Was a bee

Spatial frequency distributions of haplogroup M9a'b and its sub-haplogroups.jpg - Was a bee
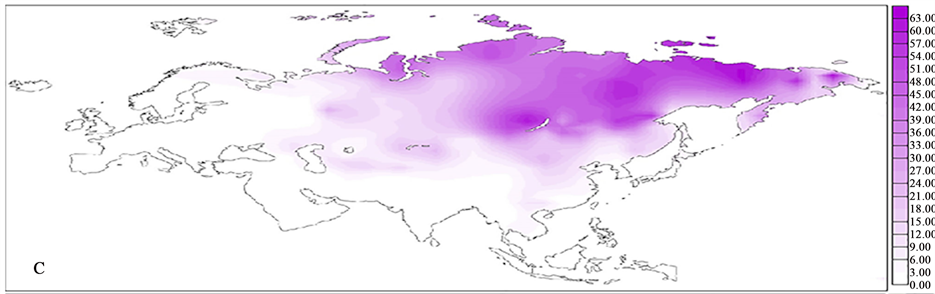
Eurasian frequency distributions of mtDNA haplogroups C.png - Was a bee

Eurasian frequency distribution of mtDNA haplogroup Z.png - Was a bee
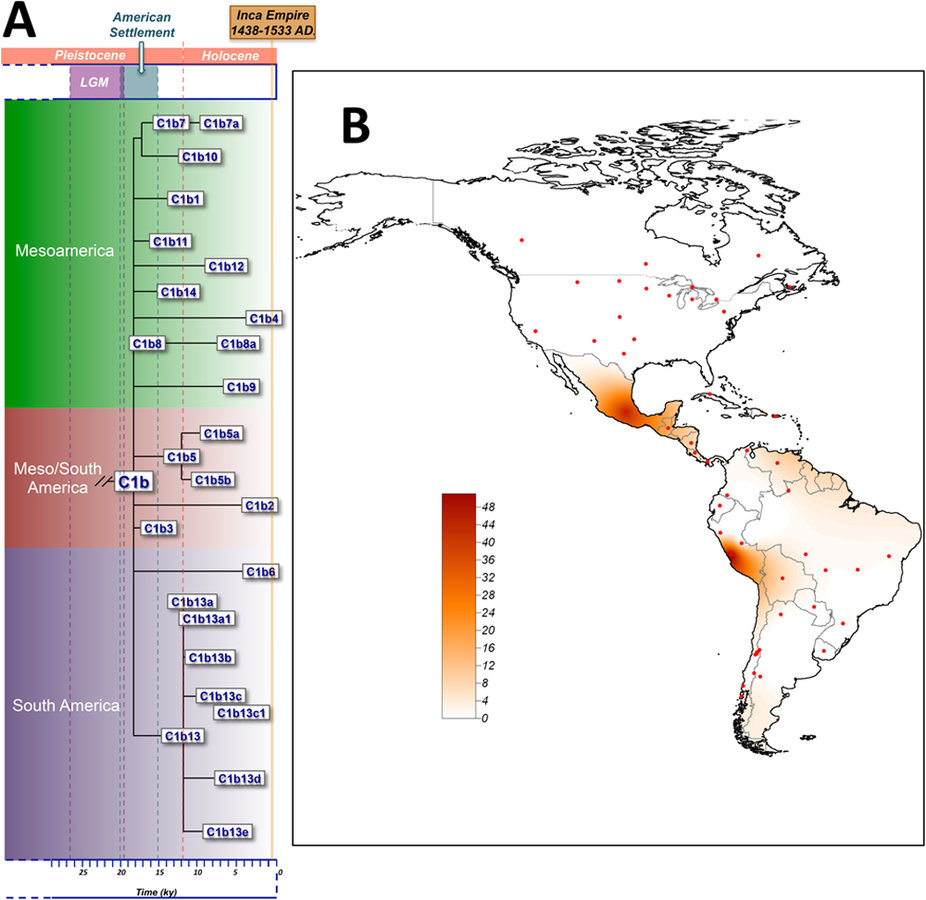
Phylogeny and distribution of mtDNA haplogroup C1b.jpg - Was a bee

MtDNA haplogroup B4a and B4a1a1 in Island Southeast Asia and the western Pacific.png - Was a bee

Spatial frequency distribution of mtDNA haplogroup E1a in Island Southeast Asia and the western Pacific.png - Was a bee

Spatial frequency distribution of mtDNA haplogroup E1b in Island Southeast Asia and the western Pacific.png - Was a bee

Spatial frequency distribution of different sub-lineages of mtDNA haplogroup H.png - Was a bee

Frequency maps for mtDNA haplogroup U6 and several sub-groups.jpg - Was a bee

Spatial frequency distribution of mtDNA haplogroups I.png - Was a bee

Spatial frequency distribution of haplogroup W.png - Was a bee

Spatial frequency distribution (%) of haplogroup H1 in western Eurasia and North Africa..png - Was a bee
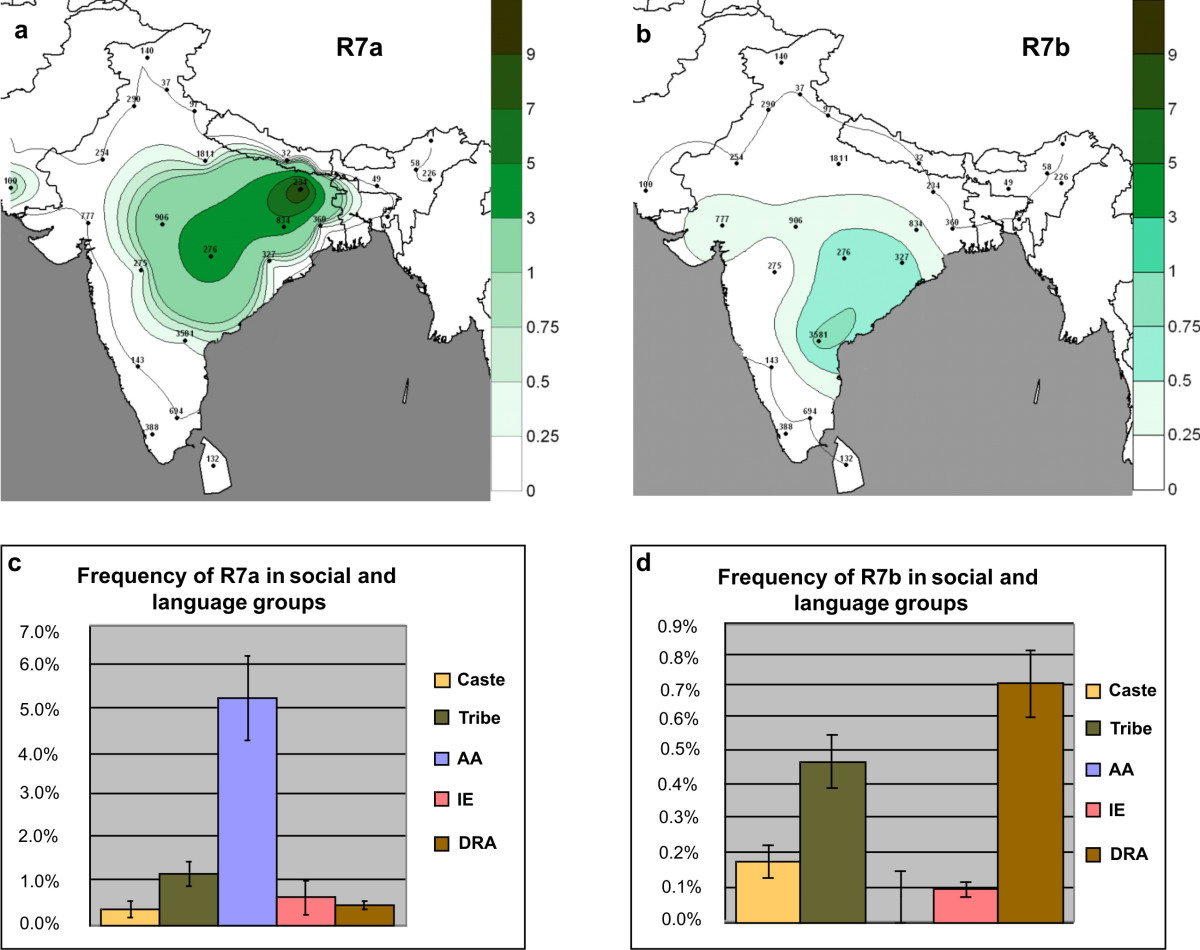
The frequency distribution of R7a and R7b clades in Indian subcontinent.jpg - Was a bee

Surfer maps and networks of haplogroups L3d and L3f.png - Was a bee

Approximate geographical distribution of the C1 sub-clades in modern and Mesolithic Yuzhnyy Oleni Ostrov populations.png - Was a bee

Frequency maps based on HVS-I data for haplogroups J.png - Was a bee

Frequency maps based on HVS-I data for haplogroups T.png - Was a bee

Frequency maps based on HVS-I data for haplogroups L4.png - Was a bee

Frequency maps based on HVS-I data for haplogroups L6.png - Was a bee

Frequency distribution maps for mtDNA haplogroups K.png - Was a bee

Frequency distribution maps for mtDNA haplogroups U8a1a.png - Was a bee

Frequency distribution maps for mtDNA haplogroups U8b1.png - Was a bee

Map of Europe showing the frequency distribution of mtDNA haplogroup HV4a1a.png - Was a bee

Frequency distribution maps for mtDNA haplogroup N9a.png - Was a bee

Frequency distribution maps for mtDNA haplogroup B5b.png - Was a bee

Frequency distribution maps for mtDNA haplogroup B4c1.png - Was a bee

Frequency distribution maps for mtDNA haplogroup R9b.png - Was a bee

Frequency distribution maps for mtDNA haplogroup F3.png - Was a bee

Frequency distribution maps for mtDNA haplogroup B4b1.png - Was a bee

Frequency distribution maps for mtDNA haplogroup Y2.png - Was a bee

Frequency distribution maps for mtDNA haplogroup F1a4.png - Was a bee

Frequency distribution maps for mtDNA haplogroup R9c.png - Was a bee

Spatial frequency distribution maps of mtDNA haplogroups R0a, R0a1a, R0a2b1 and R0a2b2.jpg - Was a bee
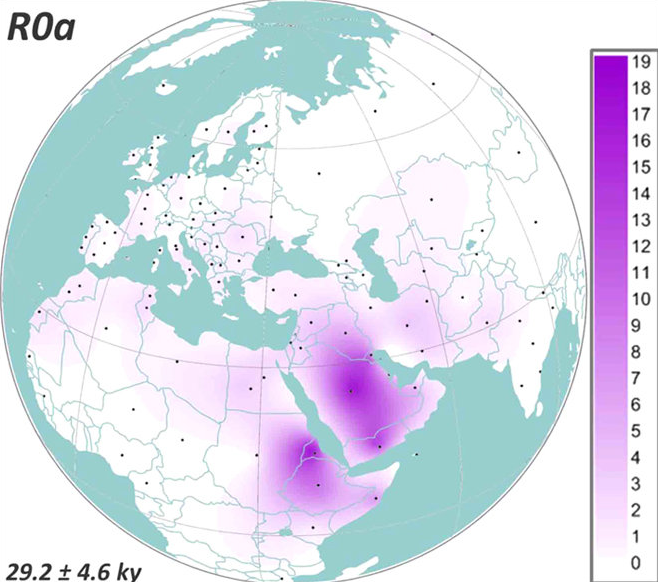
Spatial frequency distribution maps of mtDNA haplogroup R0a.png - Was a bee

Geographic maps of the mtDNA haplogroup frequencies in Iberian Peninsula.PNG - Was a bee

Contour (surface) maps of mtDNA U6a sub-haplogroup.png - Was a bee

Contour (surface) maps of mtDNA L1b sub-haplogroup.png - Was a bee

Contour (surface) maps of mtDNA U6 haplogroup.png - Was a bee

Contour (surface) maps of mtDNA M1 haplogroup.png - Was a bee

Contour (surface) maps of mtDNA L2a sub-haplogroup.png - Was a bee

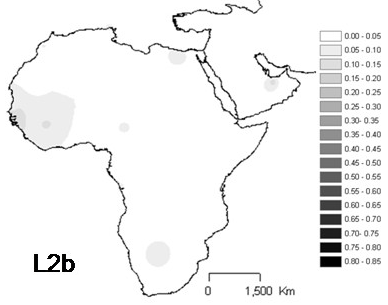
Contour (surface) maps of mtDNA L2b sub-haplogroup.png - Was a bee

Contour (surface) maps of mtDNA L3b sub-haplogroup.png - Was a bee

Contour (surface) maps of mtDNA L3d sub-haplogroup.png - Was a bee

Contour (surface) maps of mtDNA L3f sub-haplogroup.png - Was a bee

Contour (surface) maps of mtDNA L3h1b sub-haplogroup.png - Was a bee

Interpolation frequency map of mtDNA U6 across Mediterranean basin.jpg - Was a bee

LT-L298 Place of origin.png - Liseranius

Haplogroup LT (L298-P326).png - Grant65

Spatial frequency distribution of mtDNA haplogroup M12.png - Was a bee

Frequency maps based on HVS-I data for haplogroups L0a.png - Was a bee

Frequency maps based on HVS-I data for haplogroups L0b.png - Was a bee

Frequency maps based on HVS-I data for haplogroups L0d.png - Was a bee

Frequency maps based on HVS-I data for haplogroups L0f.png - Was a bee

Frequency maps based on HVS-I data for haplogroups L0k.png - Was a bee

Interpolation maps for L1b haplogroup.png - Was a bee

Interpolation maps for L1c haplogroup.png - Was a bee

Spatial frequency distributions of haplogroup M9a'b.png - Was a bee

Interpolation maps for L2a haplogroup.png - Was a bee
Interpolation maps for L2b haplogroup.png - Was a bee

Interpolation maps for L2c haplogroup.png - Was a bee

Interpolation maps for L2d haplogroup.png - Was a bee

Interpolation maps for L3b haplogroup.png - Was a bee

Interpolation maps for L3f haplogroup.png - Was a bee

Interpolation maps for L3e haplogroup.png - Was a bee

Interpolation maps for L3i haplogroup.png - Was a bee

Interpolation maps for L3x haplogroup.png - Was a bee

Interpolation maps for L3d haplogroup.png - Was a bee

Spatial frequency distribution of mtDNA haplogroup H2a.png - Was a bee
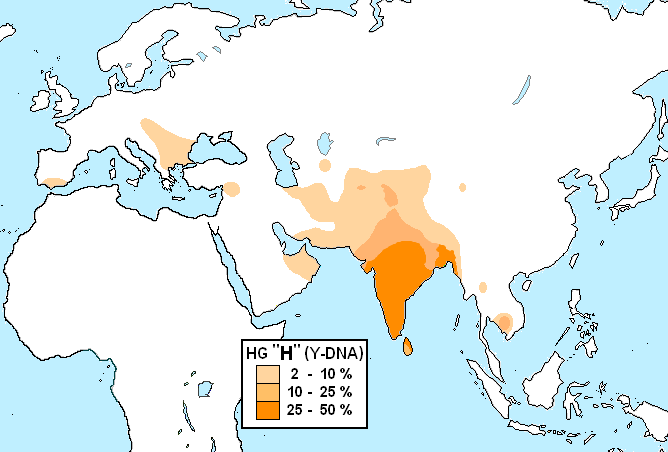
Y haplo H.png - Himalaya0H8

Migration route of Human mtDNA haplogroups.png - ABCEdit

Haplogroup J2.png - Haplogroupj2

East Eurasian admixture in Europe.png - AIexSuvorov
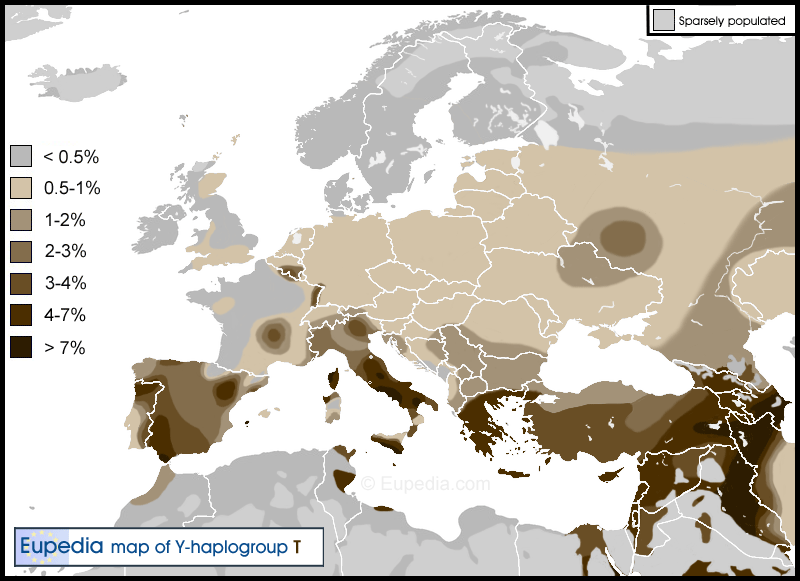
Haplogroup-T in Europe.png - Venezia Friulano