Wikimedi'Òc
Modes d'emploi

Cet album fait partie des albums
Cet album photos contient les sous-albums suivants :


Energietraeger ww.png - Tokikake

Gdp vs tpe.jpg - Wikigian

Energy Intensity.png - Feministo

Energy consumption versus GDP.png - Feministo

Coal123.jpg - Ahmedmahmoud

COSTcoal123.jpg - Ahmedmahmoud

Cost234.jpg - Ahmedmahmoud

Nsouli.jpg - Ahmedmahmoud

ENVcoal.jpg - Ahmedmahmoud

GWPeiolca.jpg - Ahmedmahmoud

Energy1.jpg - Ahmedmahmoud

ReleasesEIOLOCA1.jpg - Ahmedmahmoud

CONVENTIONALEIOLCA.jpg - Ahmedmahmoud

GWPfinal.jpg - Ahmedmahmoud

Energyfinal.jpg - Ahmedmahmoud

Pollutantsfinal.jpg - Ahmedmahmoud

Releasesfinal.jpg - Ahmedmahmoud

Energyfinal3.jpg - Ahmedmahmoud

Energyfinal4.jpg - Ahmedmahmoud

Breakcost.jpg - Ahmedmahmoud

Tagesverbrauch strom typisch.gif - Naitsabes~commonswiki
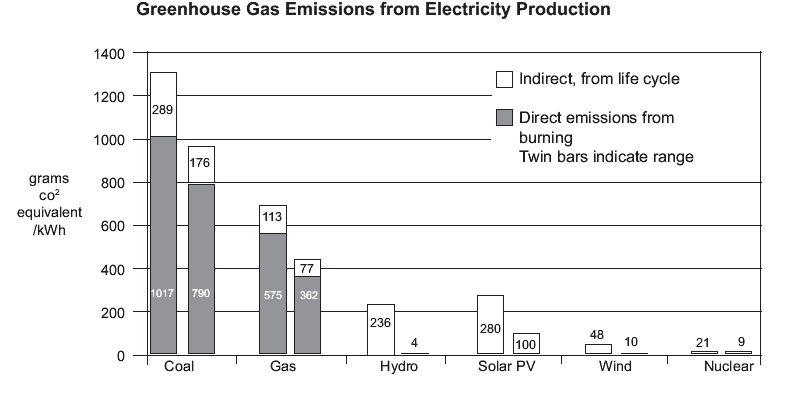
Greenhouse Gas Emissions from Electricity Production IEA.GIF - AlexH555
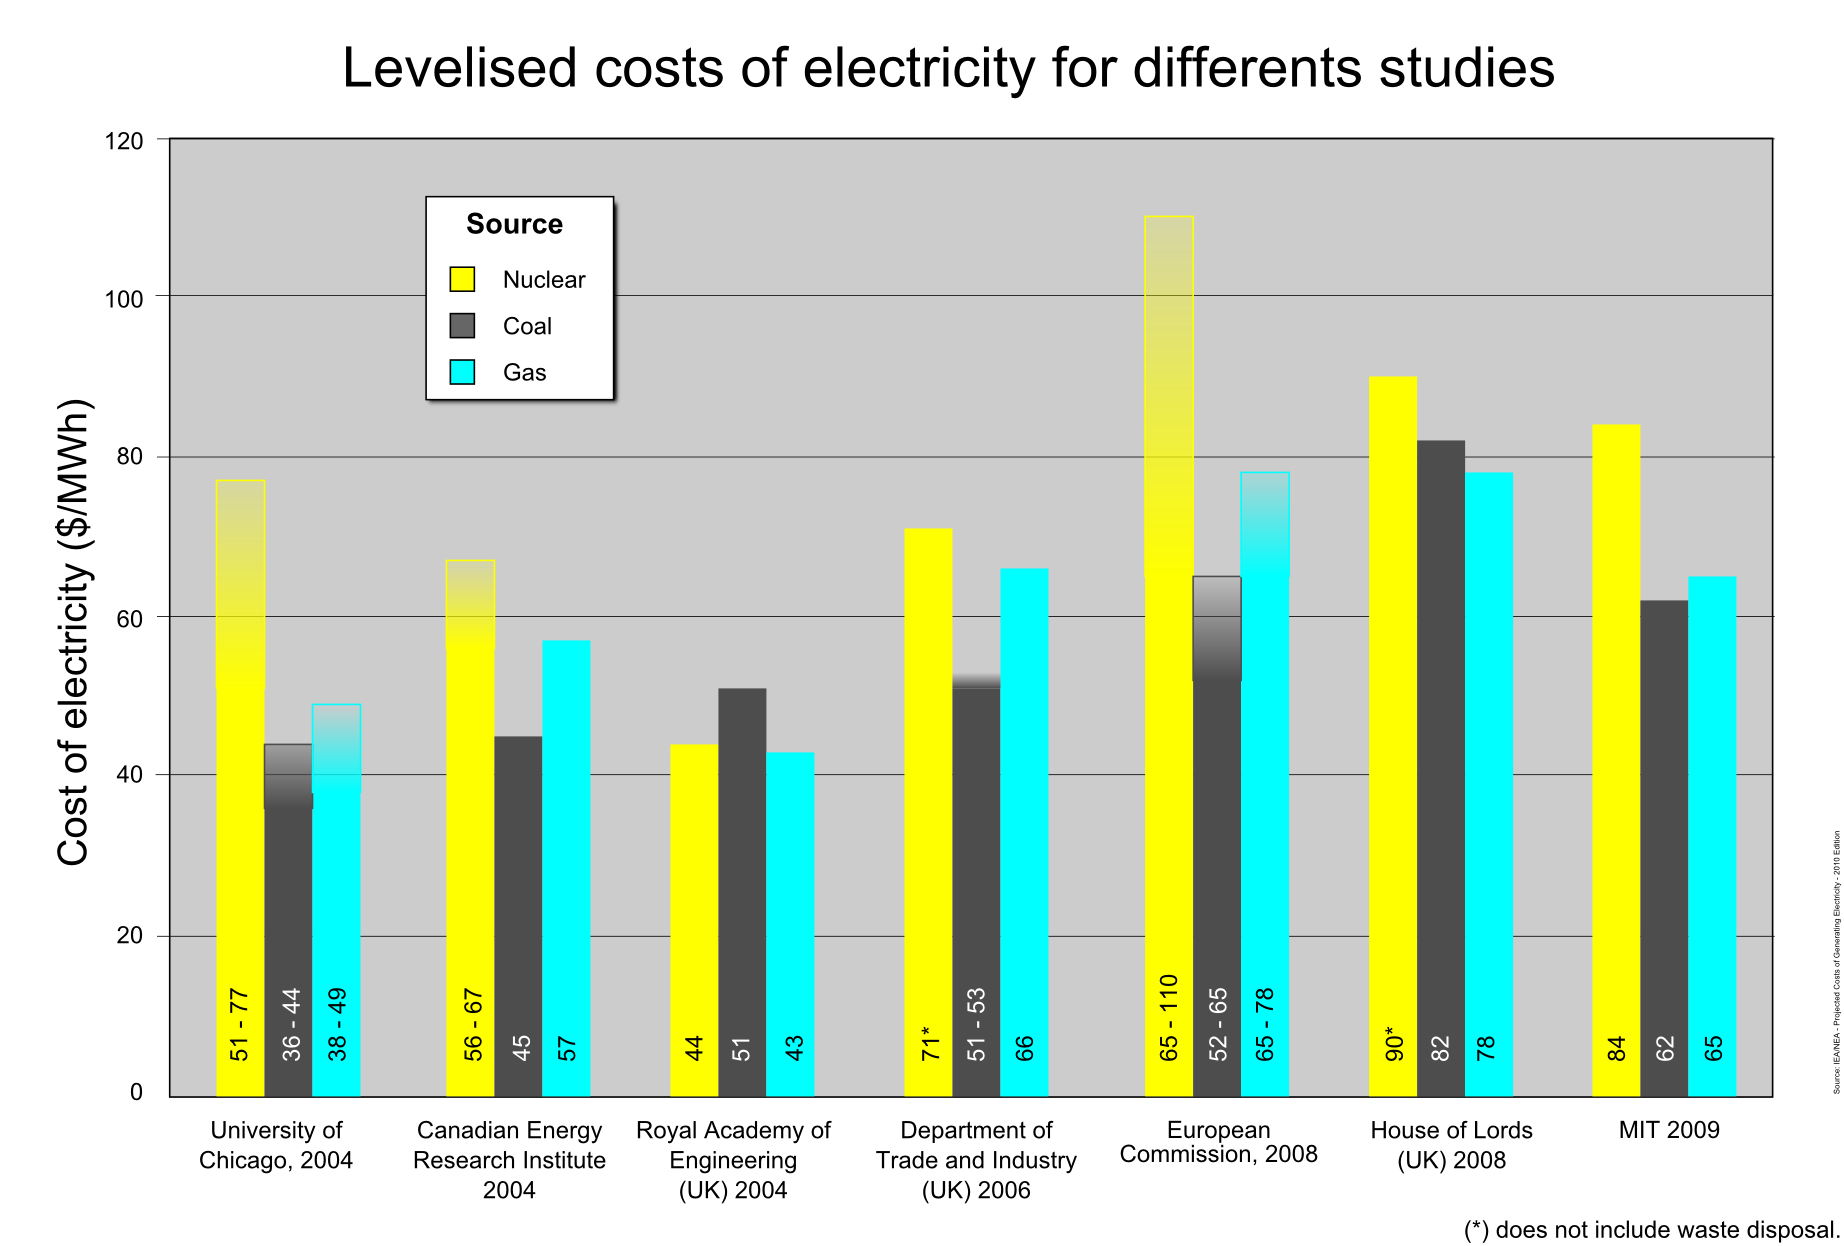
Nuke, coal, gas generating costs.png - Alpha dot

SrilankaEnergyStatistics.png - Azeez

Capacidad por fuente Colombia 2005.svg - Germarquezm
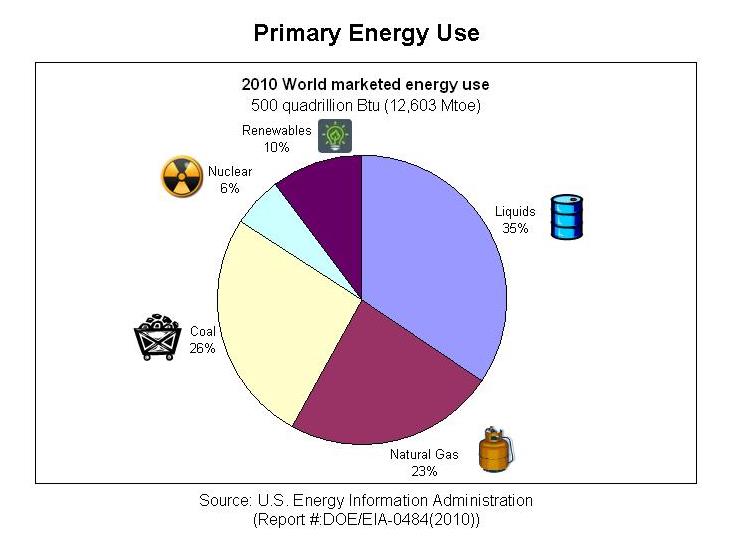
TPES 2010 estimate.jpg - Masaqui

Deaths per twh per energy source.jpg - Baubau123

TezbaCernehoUhli.png - Pastorius

Primaarenergia.png - EvelinKangro

Comsommation-pétrole-croissance-globals.png - File Upload Bot (Magnus Manske)

PowerUserDistribution.png - Philinje

Matriz energ mund 2007.jpg - Alfredobi

SrilankaEnergyStatisticsGWh.png - Azeez

EffizienzLeistungFahrzeuge.png - Rasos

Profil écologique de systèmes de chauffage (1).jpg - Isocrate

Profil écologique de systèmes de chauffage (2).jpg - Isocrate

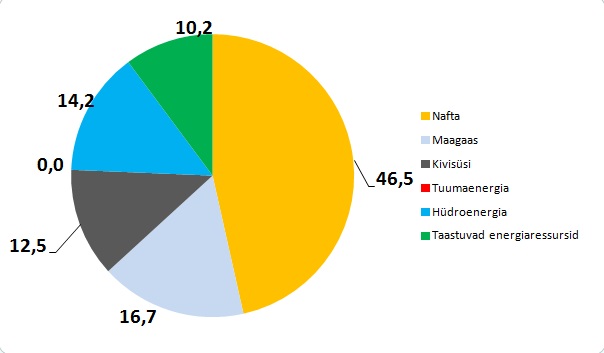
Primaarenergia tarbimise struktuur aastal 2010.jpg - TatjanaLjubimtseva

Primaarenergia tarbimise struktuur aastal 2010 Norras.png - Ilja.F
Geografia2.jpg - Vodolei95

Primaarenergia tarbimise struktuur Hispaanias.png - Geonarva

Economic comparison of wind energy.jpg - Kunal991

Consumo per Capita de Eletricidade em 2006 em kWh habitante.png - Thepalerider2012

Besoins énergétiques des trois types de l'échelle de Kardashev.svg - Indif

Energy Use per Capita.png - 未知との遭遇

GDP per unit of energy use.png - 未知との遭遇

Percent of energy imported or exported by country.png - Delphi234
Costo produzione elettricità con nucleare carbone gas.png - Umberto NURS

Energy intensity comparison (2004).svg - Fred the Oyster

Energy-prices-50y.png - GifTagger

Stromproduktion in der Türkei nach Quellen.png - Abluher

Costi MIT.png - Horcrux
TasHydro-Nov.png - DylanMcConnell

Tas-gas&liquids-generation-Nov15-Mar16.svg - DylanMcConnell
Water Energy Nexus Full Report July 2014.tiff - Collegehawk
Spang-2014-The water consumption of energy production.tif - Collegehawk
SpcialProgressIndexVsEnergInOilPerDay2.png - Sebastian Wallroth

Graph Romania electricity supply mix 2015.svg - Reeiven

Energy intensity comparison (2004)-ar.svg - باسم
Energy-Units-01.png - Cloud200
Solar Generation Figs 5-3+5-4.png - MrRenewables

Energy pricing.png - Verbal.noun

Energy pricing longterm.png - Verbal.noun
Car fuel consumption (energy per distance) when driving at steady speed - David J.C. MacKay - Sustainable energy without the Hot Air page 259, 2009 - figure321.png - Hansmuller

Energy use per capita vs. share of population in extreme poverty, OWID.svg - Fæ

Malnutrition death rate vs. GDP per capita, OWID.svg - Fæ

Protein-energy malnutrition death rates by age, OWID.svg - Fæ

Prevalence of undernourishment vs share of children who are stunted, OWID.svg - Fæ

Adjusted net savings per capita, OWID.svg - Fæ

Dietary composition by country, OWID.svg - Fæ

Dietary compositions by commodity group, OWID.svg - Fæ

Share of dietary energy derived from protein vs. GDP per capita, OWID.svg - Fæ

Share of dietary energy supply from carbohydrates vs. GDP per capita, OWID.svg - Fæ

Share of dietary energy supply from fats vs. GDP per capita, OWID.svg - Fæ

Share of energy from cereals, roots, and tubers vs. GDP per capita, OWID.svg - Fæ

Efficiency of lighting in the United Kingdom, lumen-hours per kilowatt-hour, OWID.svg - Fæ

Onshore wind cost vs. wind energy generation, OWID.svg - Fæ

Onshore wind project cost breakdown, OWID.svg - Fæ

Solar PV module prices, OWID.svg - Fæ

Solar PV system costs, OWID.svg - Fæ

Death rates from energy production, OWID.svg - Fæ

Death rates from energy production per TWh, OWID.svg - Fæ

Death rates from low-carbon energy production, OWID.svg - Fæ

Energy imports and exports, OWID.svg - Fæ

Energy use vs. GDP per capita, OWID.svg - Fæ

Fossil fuel vs. low-carbon energy shares (substitution method), OWID.svg - Fæ

Health effects of energy production, OWID.svg - Fæ

Hypothetical number of deaths from energy production, OWID.svg - Fæ

Investment in renewable energy, by technology, OWID.svg - Fæ

Renewable Energy Investment (% of GDP), OWID.svg - Fæ

Solar PV Cumulative Capacity, OWID.svg - Fæ

Solar PV module prices vs. cumulative capacity, OWID.svg - Fæ

Prevalence of undernourishment vs. daily supply of calories, OWID.svg - Fæ

Carbon Dioxide Emissions Factor, kg CO₂ per MWh, OWID.svg - Fæ

Fossil fuel price index, OWID.svg - Fæ

Number of people who are undernourished, OWID.svg - Fæ

Prevalence of undernourishment (%) in developing countries since 1970, OWID.svg - Fæ

Share of the population who are undernourished vs GDP per capita, OWID.svg - Fæ

The price for lighting in the UK, OWID.svg - Fæ

Energy efficiency of meat and dairy production, OWID.svg - Fæ

Hidden Hunger Index vs. share of energy intake from cereals, roots and tubers, OWID.svg - Fæ

Accumulated Cyclone Energy of North Atlantic hurricanes, OWID.svg - Cptmrmcmillan
Public opposition to nuclear energy production, OWID.svg - Fæ

Renewable energy consumption vs. GDP per capita, OWID.svg - Fæ

Solar energy generation vs. capacity, OWID.svg - Fæ

Bilan GES filières energétiques.jpg - Pigmalyon

Death rates from energy production per TWh.png - Cloud200

CarbonplotEU.png - Matclime
Consommation d'énergie durant le cycle de vie des modes de transport.png - Bernard de Go Mars

Cost of electricity by source.png - Prototyperspective

EES EAEC. Производство электроэнергии в Латвии, 1945-2019 гг., млрд.кВт∙ч .svg - Idan4889

Electricity production in Japan.svg - Tallungs

Consommation mondiale d'énergie.svg - Espandero

EES EAEC. Энергетическая зависимость Греции, 1998-2019, проценты.svg - Idan4889

Death rates from energy production per TWh (including solar).svg - Prosfilaes

Kaya decomposition of the main drivers of fossil CO2 emissions, considering population, GDP per person, energy per GDP, and CO2 emissions per energy use.png - Prototyperspective

Ausbau der Solarenergie in Indien in MW(peak).svg - Ildottoreverde

Ausbau erneuerbarer Energien weltweit nach installierter Kapazität in GW.svg - Ildottoreverde

Balloon graph representing quality EROI.png - 1redfox

সমগ্র বিশ্বের বার্ষিক শক্তির ব্যবহার.svg - আফতাবুজ্জামান

Access-to-clean-fuels-and-technologies-for-cooking-vs-per-capita-energy-consumption (OWID 0001).png - Jason.nlw

Access-to-electricity-of-population-vs-share-in-extreme-poverty (OWID 0009).png - Jason.nlw

Access-to-electricity-urban-vs-rural (OWID 0011).png - Jason.nlw

Access-to-electricity-vs-gdp-per-capita (OWID 0041).png - Jason.nlw

Annual-change-primary-energy-source (OWID 0060).png - Jason.nlw

Annual-change-coal (OWID 0066).png - Jason.nlw

Annual-primary-energy-fossil-vs-low-carbon (OWID 0096).png - Jason.nlw

Annual-percentage-change-solar (OWID 0098).png - Jason.nlw

Annual-percentage-change-oil (OWID 0099).png - Jason.nlw

Annual-percentage-change-low-carbon (OWID 0101).png - Jason.nlw

Annual-percentage-change-hydro (OWID 0103).png - Jason.nlw

Annual-percentage-change-coal (OWID 0105).png - Jason.nlw

Co-emissions-per-capita-vs-fossil-fuel-consumption-per-capita (OWID 0147).png - Jason.nlw

Change-energy-consumption (OWID 0163).png - Jason.nlw

Change-energy-gdp-per-capita (OWID 0164).png - Jason.nlw

Coal-vs-gdp-per-capita (OWID 0256).png - Jason.nlw
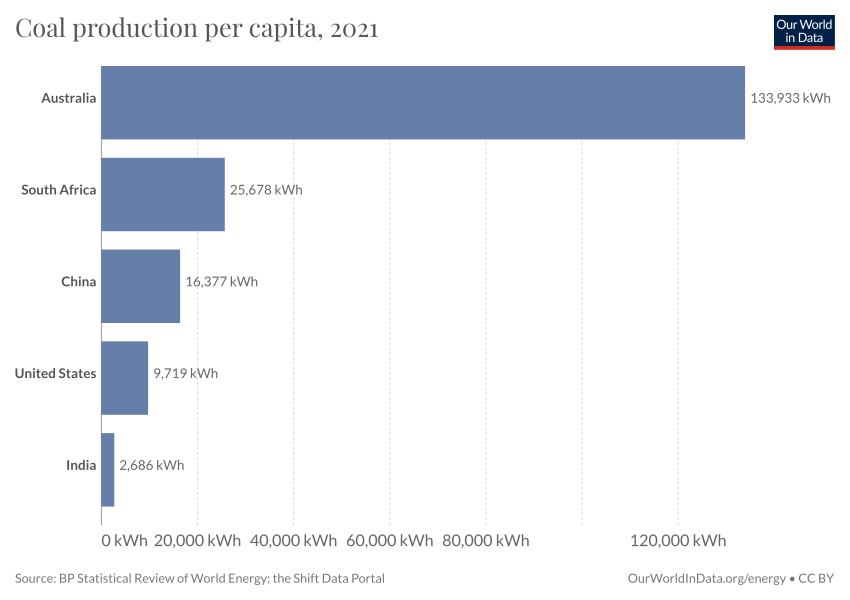
Coal-prod-per-capita (OWID 0263).png - Jason.nlw

Elec-mix-bar (OWID 0267).png - Jason.nlw
Elec-fossil-nuclear-renewables (OWID 0268).png - Jason.nlw

Energy-use-per-person-vs-gdp-per-capita (OWID 0345).png - Jason.nlw

Energy-use-per-capita-vs-share-of-population-in-extreme-poverty (OWID 0349).png - Jason.nlw

Energy-use-per-capita-vs-gdp-per-capita (OWID 0350).png - Jason.nlw

Energy-use-gdp-decoupling (OWID 0352).png - Jason.nlw

Energy-intensity-vs-gdp (OWID 0357).png - Jason.nlw

Energy-imports-and-exports-energy-use (OWID 0359).png - Jason.nlw

Energy-embedded-traded-goods (OWID 0360).png - Jason.nlw

Energy-consumption-by-source-and-country (OWID 0362).png - Jason.nlw

Electricity-imports-share-demand (OWID 0382).png - Jason.nlw

Electricity-generation (OWID 0384).png - Jason.nlw
Electricity-fossil-renewables-nuclear-line (OWID 0386).png - Jason.nlw

Fossil-fuels-share-energy (OWID 0392).png - Jason.nlw

Fossil-fuels-per-capita (OWID 0395).png - Jason.nlw

Gas-prod-per-capita (OWID 0485).png - Jason.nlw

Levelized-cost-of-energy (OWID 0573).png - Jason.nlw
Nuclear-primary-energy (OWID 0612).png - Jason.nlw
Nuclear-renewables-electricity (OWID 0614).png - Jason.nlw

Patents-filed-for-renewables (OWID 0672).png - Jason.nlw

Patents-energy-storage (OWID 0676).png - Jason.nlw

Patents-electric-vehicles (OWID 0677).png - Jason.nlw

Oil-prod-per-capita (OWID 0704).png - Jason.nlw

Number-with-without-clean-cooking-fuels (OWID 0714).png - Jason.nlw

Number-without-electricity-by-region (OWID 0715).png - Jason.nlw

Per-capita-fossil-energy-vs-gdp (OWID 0766).png - Jason.nlw

Per-capita-gas (OWID 0767).png - Jason.nlw

Per-capita-energy-source-stacked (OWID 0768).png - Jason.nlw

Per-capita-energy-stacked (OWID 0770).png - Jason.nlw

Per-capita-consumption-based-co-emissions-vs-per-capita-energy-consumption (OWID 0777).png - Jason.nlw

People-without-clean-cooking-fuels-region (OWID 0800).png - Jason.nlw
Primary-energy-fossil-nuclear-renewables (OWID 0804).png - Jason.nlw

Primary-energy-consumption-by-region (OWID 0806).png - Jason.nlw

Percentage-change-energy-by-source (OWID 0852).png - Jason.nlw

Per-capita-oil (OWID 0858).png - Jason.nlw

Renewable-energy-investment-of-gdp (OWID 0866).png - Jason.nlw

Production-vs-consumption-energy (OWID 0898).png - Jason.nlw

Production-consumption-carbon-intensity-energy (OWID 0899).png - Jason.nlw

Production-consumption-energy-per-person (OWID 0900).png - Jason.nlw
Primary-energy-share-nuclear-renewables (OWID 0904).png - Jason.nlw

Primary-energy-source-bar (OWID 0906).png - Jason.nlw

Share-energy-source-sub (OWID 0913).png - Jason.nlw

Share-electricity-source-facet (OWID 0916).png - Jason.nlw

Share-elec-by-source (OWID 0925).png - Jason.nlw

Share-with-access-to-electricity-vs-per-capita-energy-consumption (OWID 0974).png - Jason.nlw

Share-that-has-access-to-electricity-vs-per-capita-co-emissions (OWID 0975).png - Jason.nlw

Share-of-primary-energy-consumption-by-source (OWID 0981).png - Jason.nlw

Share-of-low-carbon-energy-vs-gdp (OWID 0983).png - Jason.nlw

Share-of-children-who-are-stunted-vs-co-emissions-per-capita (OWID 1003).png - Jason.nlw
Sub-energy-fossil-renewables-nuclear (OWID 1072).png - Jason.nlw

Solar-pv-prices (OWID 1086).png - Jason.nlw

Solar energy generation by region OWID cs.svg - Jirka Dl