Wikimedi'Òc
Modes d'emploi

Cet album fait partie des albums
Cet album photos contient les sous-albums suivants :


Cold-spell-en-route-delays-spring-arrival-and-decreases-apparent-survival-in-a-long-distance-12898 2017 121 MOESM1 ESM.ogv - Open Access Media Importer Bot

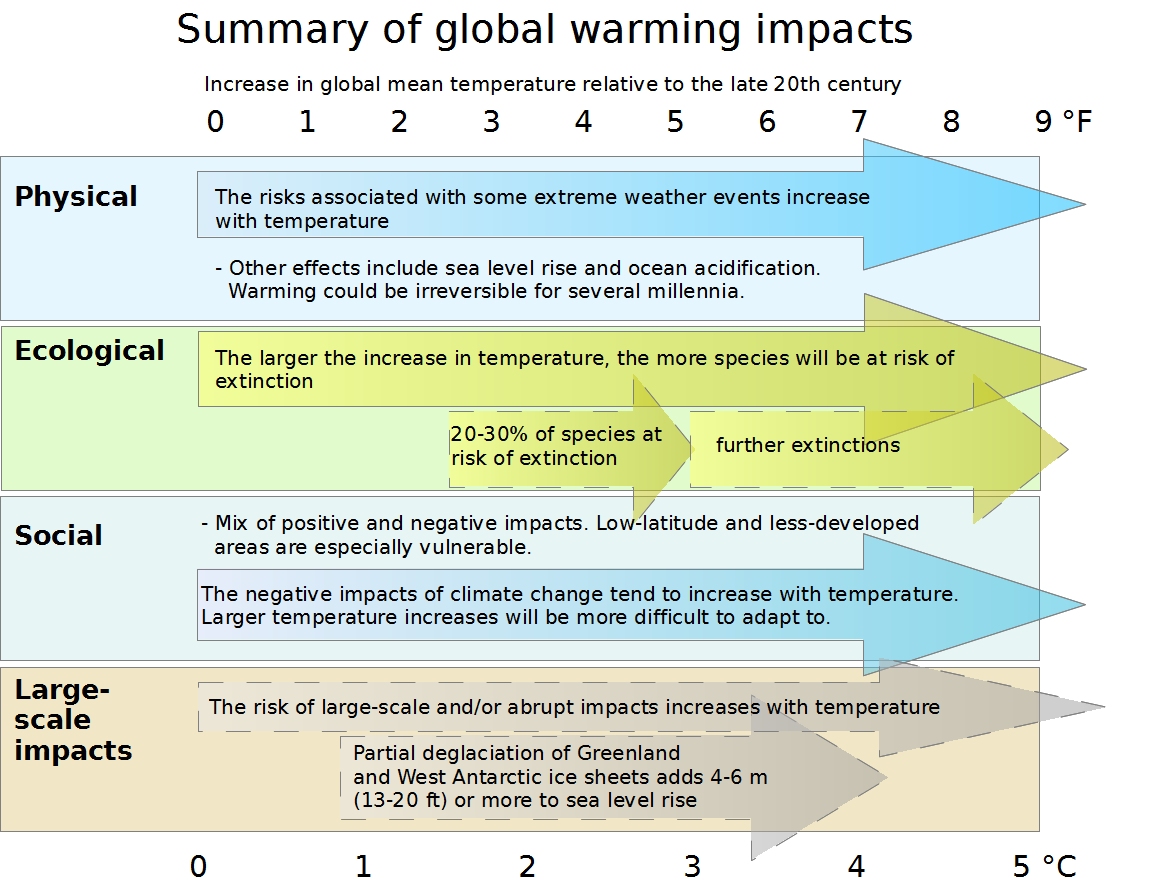
Impacts of Global Warming.png - Dilaudid
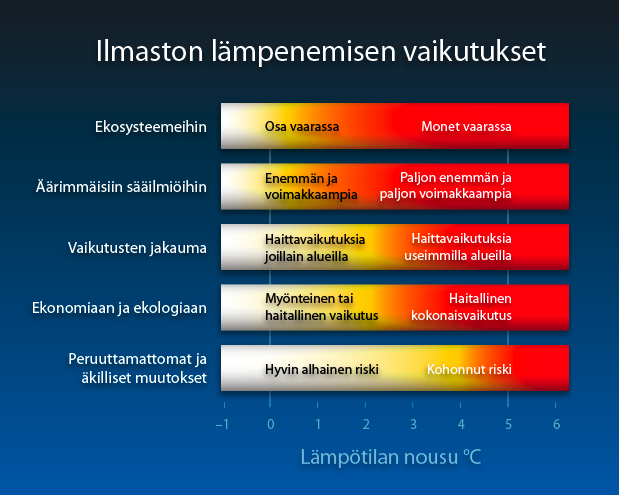
Ilmaston lämpenemisen vaikutukset.png - Dilaudid

US precipitation trends.gif - Tom4216697
Plant Productivity in a Warming World.ogv - Originalwana

NOAAprecipitationtrend.jpg - Sokavik

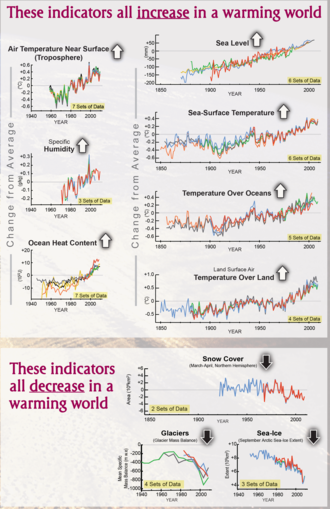
Changes in climate indicators that show global warming.png - Enescot

Map of projected global warming across the globe by the 2050s. Projections based on three SRES greenhouse gas emissions scenarios. Data from CMIP3 (2007).jpg - Enescot

Temperatures across the world in the 1880s (left) and the 1980s (right), as compared to average temperatures from 1951 to 1980 (US EPA).jpg - Enescot

Projected change in annual average precipitation for the 21st century, based on the SRES A1B emissions scenario, and simulated by the GFDL CM2.1 model.png - Enescot
Effects of global warming, plotted against changes in global mean temperature.png - Enescot
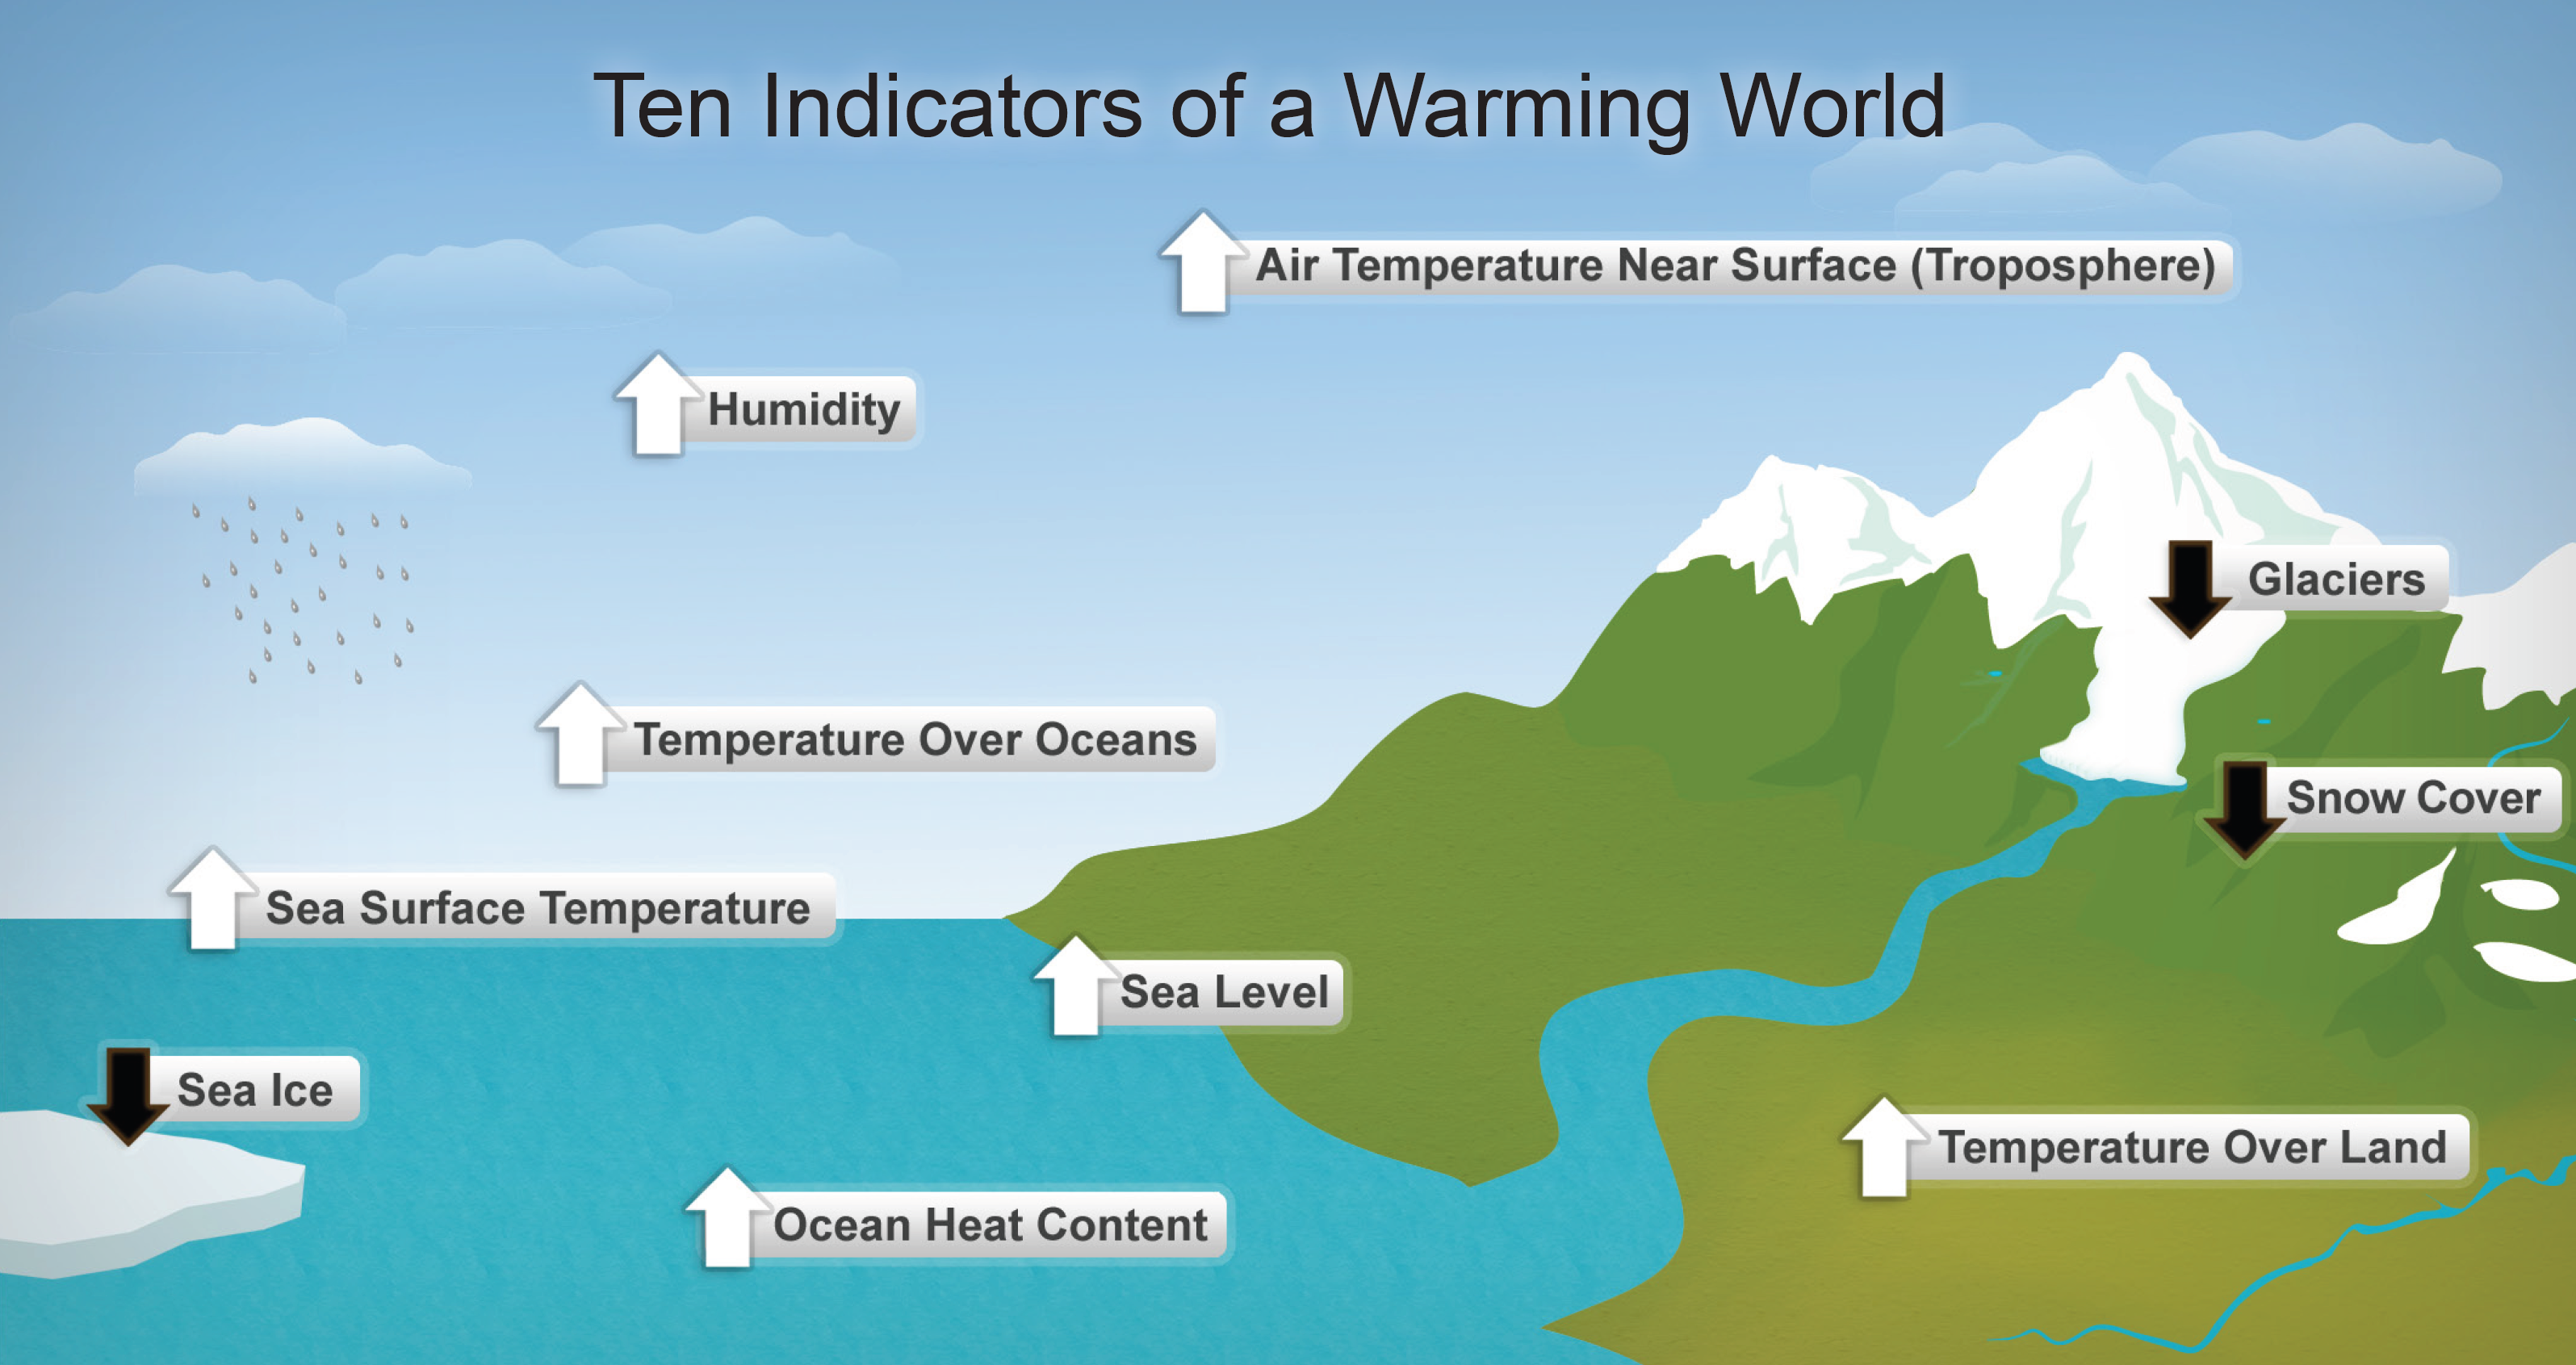
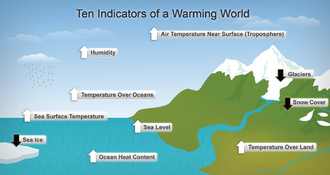
Diagram showing ten indicators of global warming.png - Enescot

Climate Change.png - LeafcutterMedia
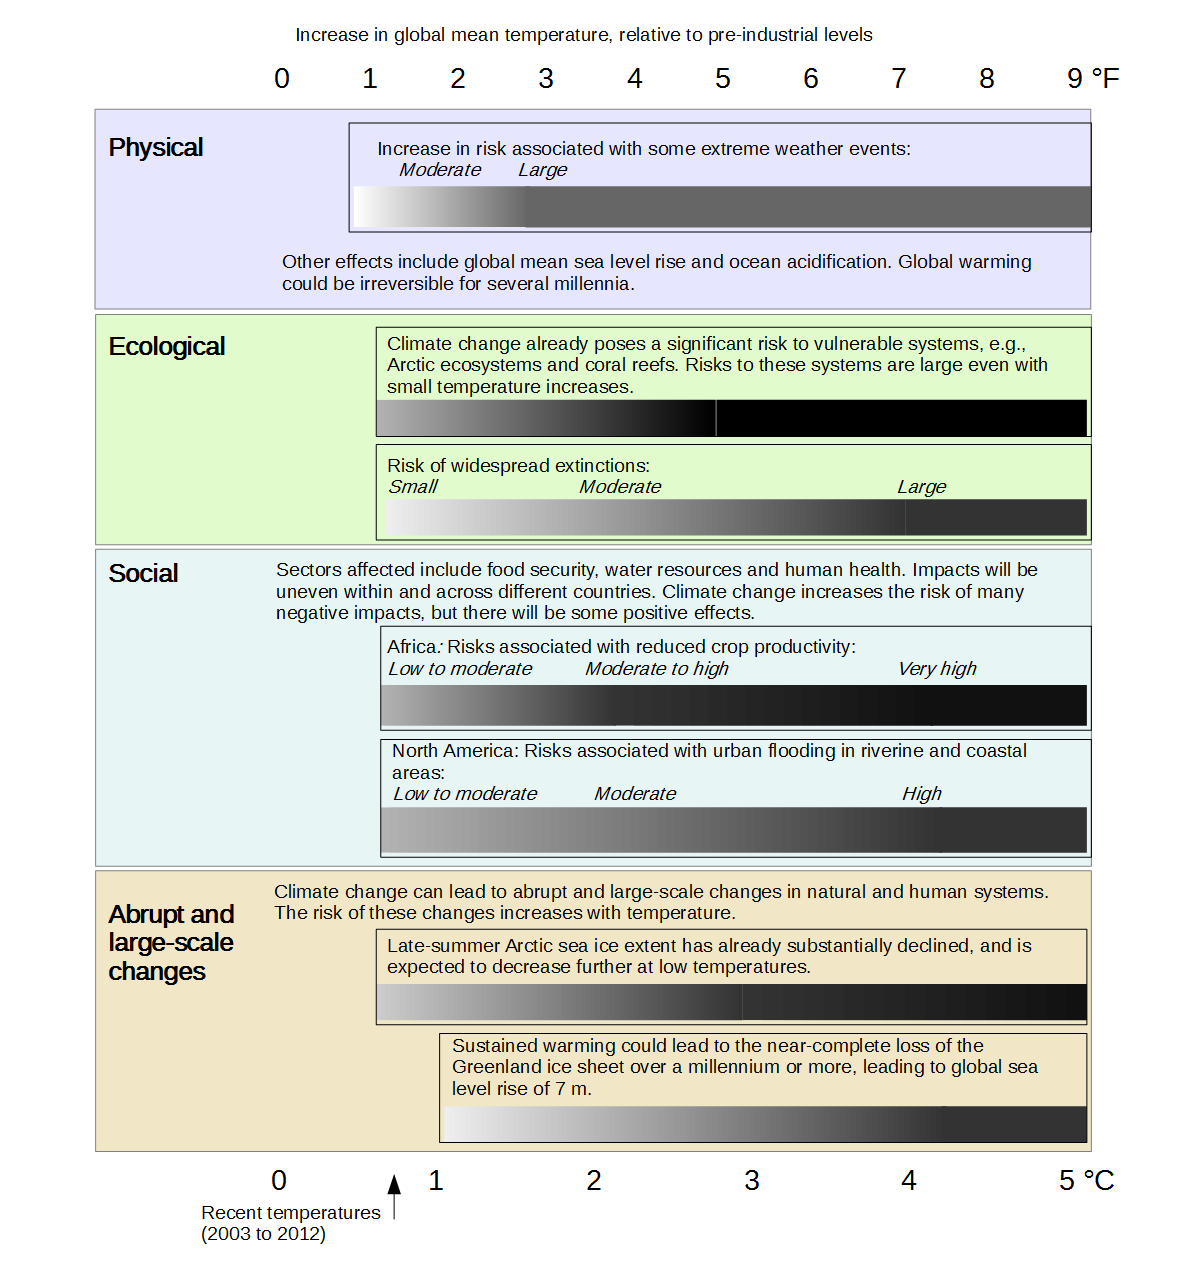
Impacts of global warming 2.png - Enescot

Impacts of global warming 2 svg.svg - Basquetteur

Projected global warming in 2100 for a range of emission scenarios.png - Enescot

Risks associated with wildfires in North America due to climate variability and change.png - Enescot

Contropedia Layer View.png - Sdivad

Impacts of global warming es impacto calentamiento global.svg - Basquetteur
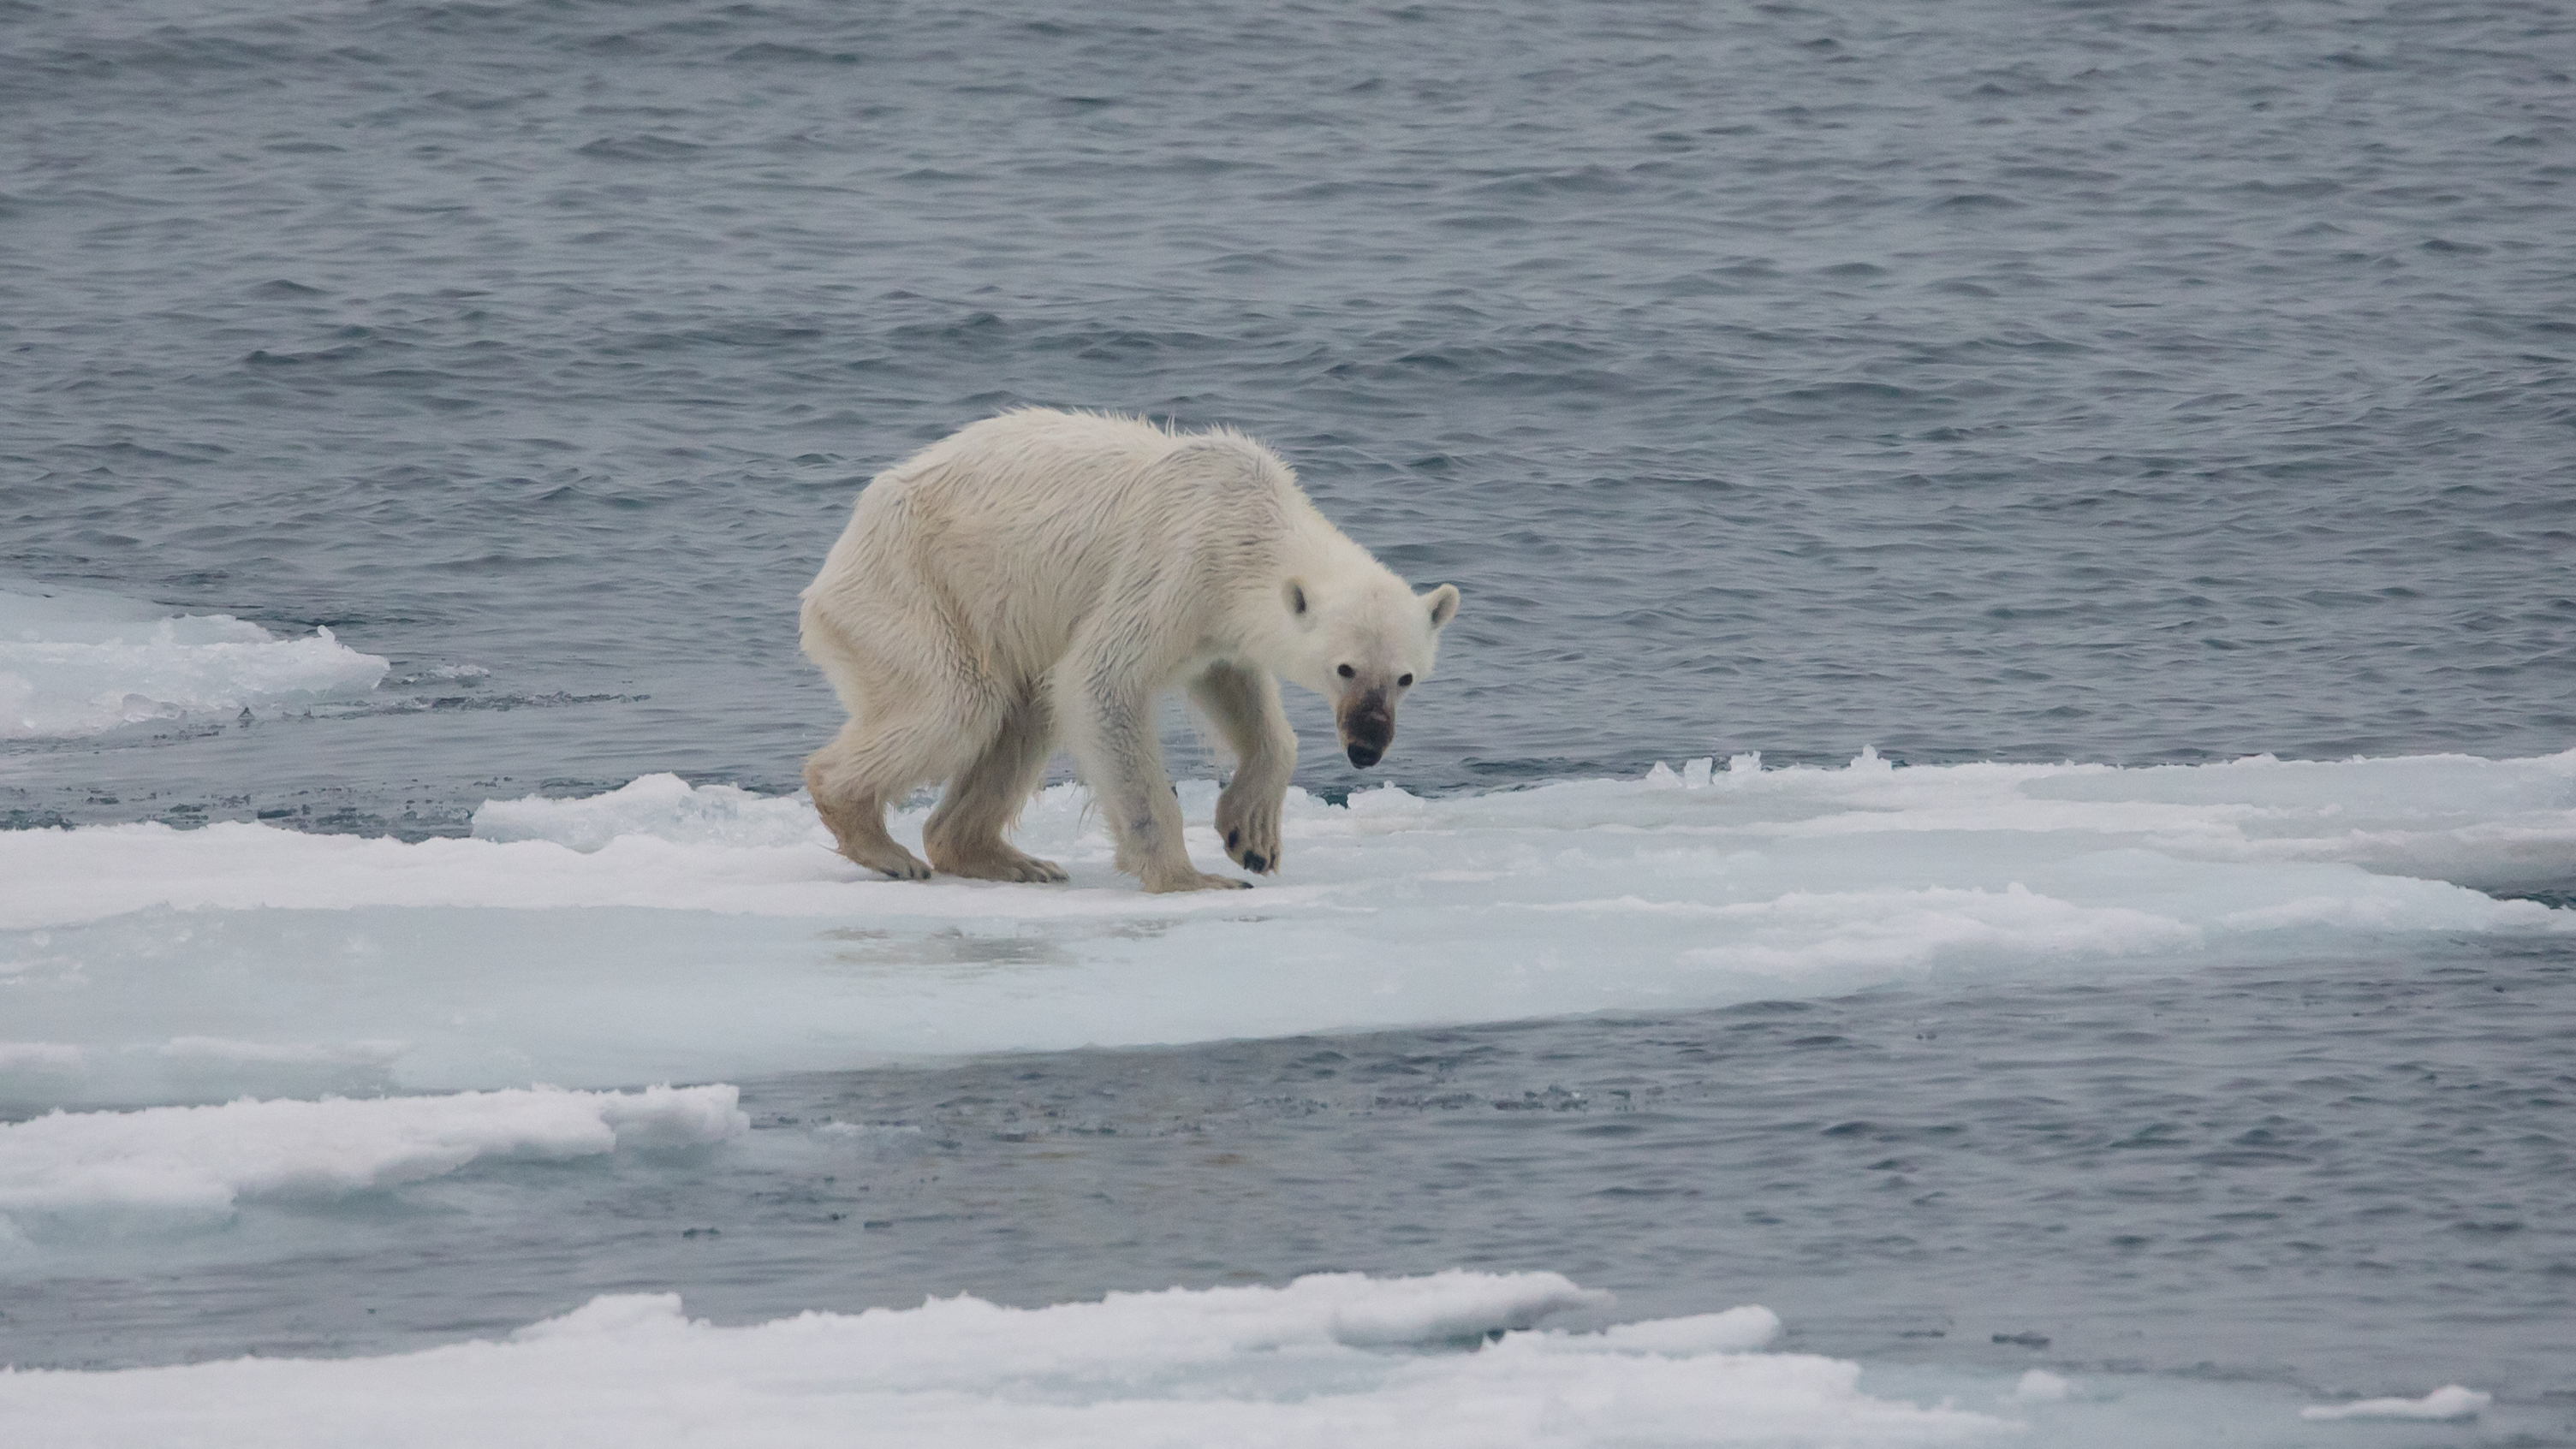
Endangered arctic - starving polar bear.jpg - AWeith

Säulendiagramm zu Klimarisiken.svg - Wdwdbot

IPCC AR5 WGII burning embers-de.svg - Wdwdbot

Global sea level rise from 1992 to 2020, satellite data chart.svg - Geek3

Alt gmsl seas not rem.svg - Geek3

Heating and cooling days in Europe.jpg - SustainableSilvia

NASA-Satellite-sea-level-rise-observations.jpg - RCraig09

Extreme weather events 2014-2015.png - MartinPoulter

Projected Average Surface Temperature Change IPCC5 2013.png - MartinPoulter

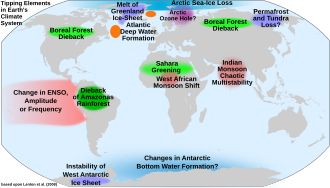
Climate-tipping-points-en.svg - DeWikiMan

Examples of projected impacts and vulnerabilities associated with climate change.svg - John Cummings

Exemples des prévisions des effets et facteurs de vulnérabilité liés au changement climatique.svg - John Cummings

Ejemplos de efectos y vulnerabilidades proyectados vinculados al cambio climático.svg - John Cummings

20231129 Survey - I expect to be displaced by climate change - Ipsos.svg - RCraig09
Staan er in 2070 palmbomen op de purperen heide.webm - PJ Geest

Projected Change in Temperatures by 2090.png - Efbrazil

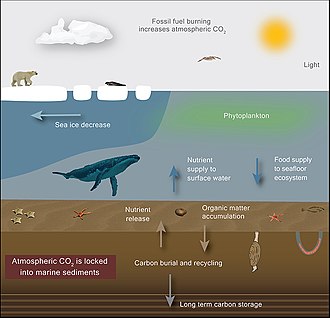
Microorganisms and climate change.png - Epipelagic
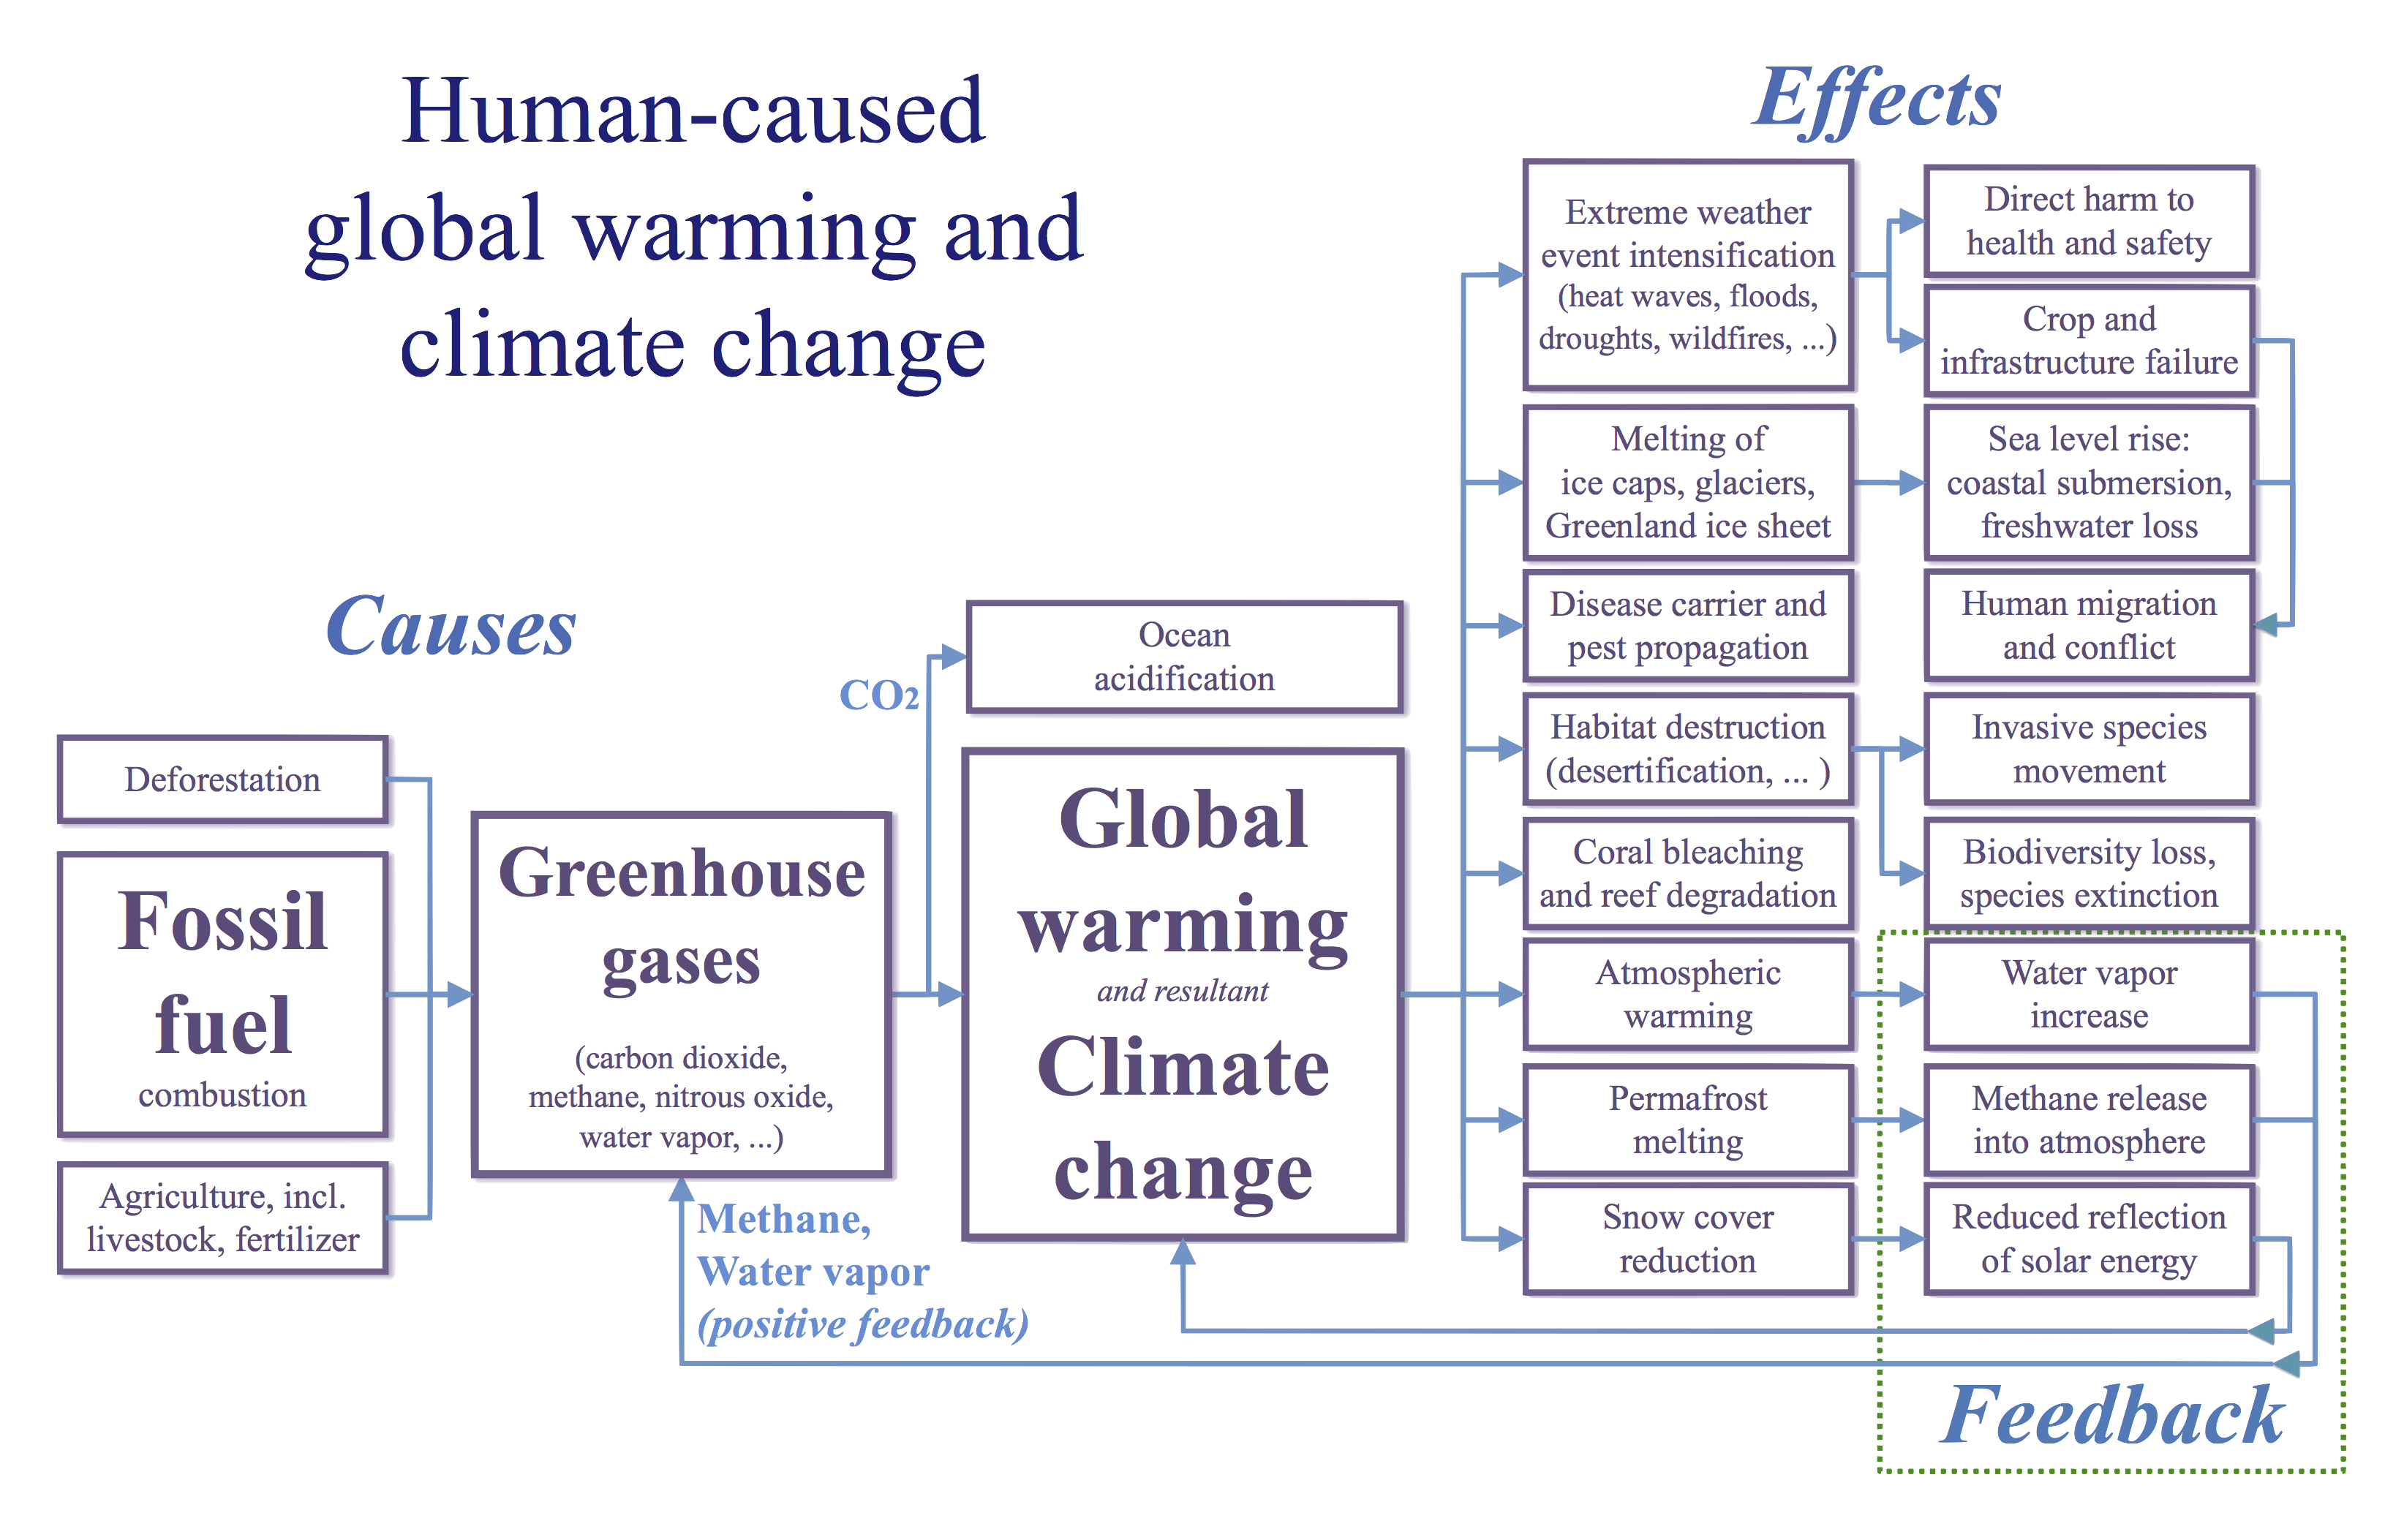
20200101 Global warming - climate change - causes effects feedback.png - RCraig09

AGW Causes Effects.demo.png - J. Johnson

20200118 Global warming and climate change - vertical block diagram - causes effects feedback.png - RCraig09

Climate change threats to coral reefs.png - Epipelagic

Economic Impacts of 1.5°C, OWID.svg - Fæ

Economic Impacts of 2°C, OWID.svg - Fæ

Economic Impacts of 2°C vs 1.5°C, OWID.svg - Fæ

Social tipping dynamics for stabilizing Earth’s climate by 2050 - Figure 3 - Social tipping elements and associated social tipping interventions with the potential to drive rapid decarbonization in the World–Earth system.jpg - Daniel Mietchen

Social tipping dynamics for stabilizing Earth’s climate by 2050 - Figure 1 - The rate of change in annual greenhouse gas emissions required for net decarbonization.jpg - Daniel Mietchen

Social tipping dynamics for stabilizing Earth’s climate by 2050 - Figure 2 - Stability landscape of the world’s socioeconomic system and social tipping dynamics.jpg - Daniel Mietchen

Projected Change in Temperatures.svg - Jirka Dl

Effects of climatic changes on the ocean.png - Epipelagic

Global Warming Predictions-da.png - Brinchj
Folgen der Erderwärmung.webm - ZDF Terra X Redaktion
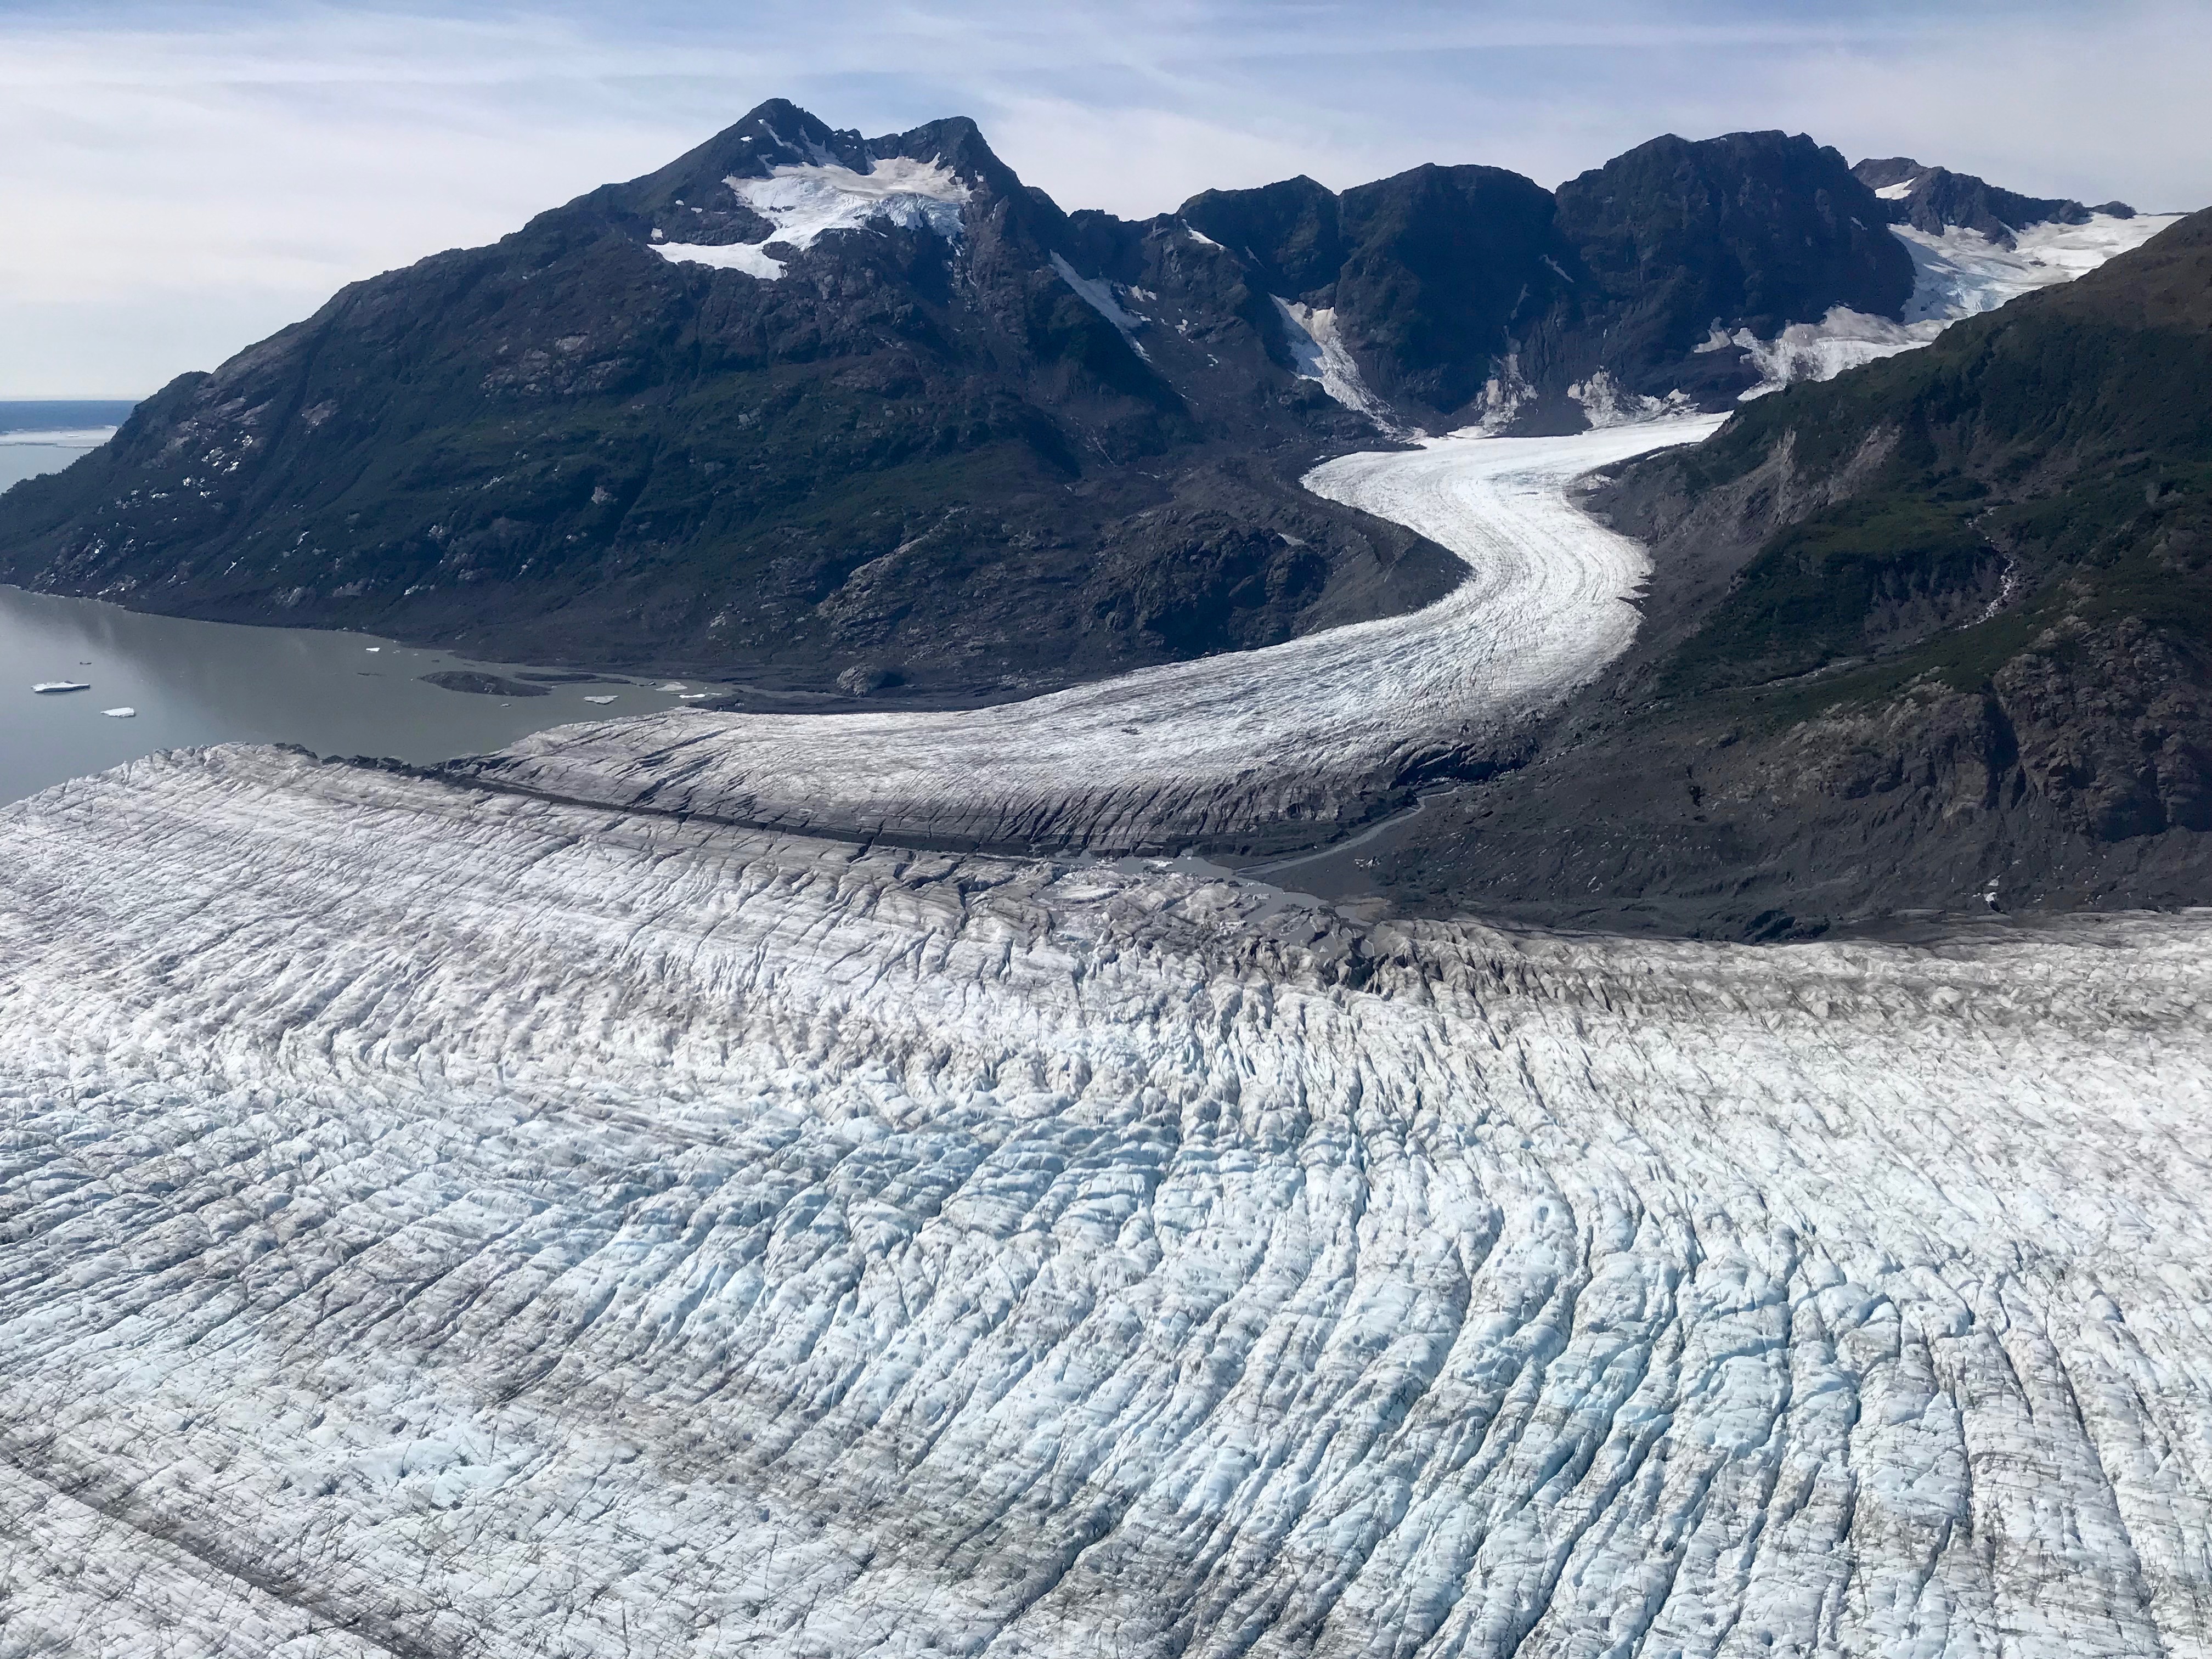
Yakutat Icefield.jpg - Prototyperspective

Climate-tipping-points-pl.svg - Rotifyld

Damage-costs-from-natural-disasters.png - Waddie96

Effects of climatic changes on the ocean (cropped).png - Camelia.boban

20201211 Billion dollar events related to climate change - U.S. -en.svg - RCraig09

Climate change causes sea ice to melt.jpg - Epipelagic

Decrease of old Arctic Sea ice 1982-2007 ian.gif - Turbojet

Changement prévu des températures d'ici 2090.svg - Espandero

Soil moisture and climate change.svg - Jojit fb

Precipitation and climate change.svg - Efbrazil

Climate-tipping-points-fr.svg - STyx

Mean number of months per year where heat stress exceeds 'very strong' levels (38°C on the UTCI scale) in present (2020) and future climates.webp - Prototyperspective

Monthly mean temperatures, precipitation, land cover fractions under the RCP6.0 scenario.webp - Prototyperspective

Earth's Heat Accumulation.png - Bikesrcool

20200118 Global warming and climate change - vertical block diagram - causes effects feedback.svg - RCraig09

Projected Change in Temperatures-cs.svg - Jirka Dl

Aufnahme der durch Klimawandel verursachten Wärme durch Ozeane.svg - Mrmw

Karte Wie die Ozeane CO2 speichern.svg - Mrmw

Many Europeans believe they might have to move because of climate change.jpg - Noura2021

20220712 Global economic damage due to greenhouse gas emissions - by country.svg - RCraig09
Overlap between state fragility, extreme heat, and nuclear and biological catastrophic hazards.jpg - Prototyperspective

Overlap between future population distribution and extreme heat.jpg - Prototyperspective

1950- High tide flooding, by year - NOAA tide gauges (U.S.).svg - RCraig09

2050 Projected sea level rise - United States coasts - NOAA.svg - RCraig09

1980- Cost of billion dollar hurricanes - US - variwide chart - NOAA data.svg - RCraig09

2022 Counting the cost of disasters - climate change - Christian Aid.svg - RCraig09

2015-2100 Impacts of global warming on glaciers and sea level rise.svg - RCraig09

Duration of the yearly snow cover ring-width reconstruction together with modelled record for the Alps.webp - Prototyperspective

Climate-tipping-points-es.svg - Senda1234

Schematic overview on the central role of the Earth heat inventory and its linkage to anthropogenic emissions, the Earth energy imbalance, change in the Earth system, and implications for ecosystems and human systems.png - Prototyperspective

1960- Groundwater loss - depletion - Central Valley of California.svg - RCraig09

Ocean warming continues in 2021 (Copernicus).jpg - OptimusPrimeBot

Phytoplankton bloom in the Indian Ocean (Copernicus).jpg - OptimusPrimeBot

Phytoplankton bloom southwest of Iceland (Copernicus).jpg - OptimusPrimeBot

2015-2100 Impacts of global warming on glaciers and sea level rise-cs.svg - Jirka Dl

1983- Canada wildfires - area burned annually.svg - Mule hollandaise

Do you think you will have to move because of climate change?.jpg - Noura2021
The WMO State of the Global Climate report 2022.webm - Prototyperspective

2050 Production risk of commodities due to climate change.svg - RCraig09

2050 Production risk of commodities due to climate change - single stressor version.svg - RCraig09
The Australian Institute of Marine Science (AIMS) is researching the current and possible future impacts of climate change on tropical marine ecosystems.webm - Prototyperspective

Endangered arctic - starving polar bear (cropped).jpg - Zzzs
The Massive Climate Exodus – Migration Will Shatter Nations (scifi climate fiction video made with AI).webm - Prototyperspective

1960- Heat wave indicators - US.svg - RCraig09

2000- Declared flood disasters - US.svg - RCraig09
Wikipedia - Effects of climate change.mp3 - Prototyperspective

1960- Annual average number of days spent in heat waves - US.svg - RCraig09

2000- Glacier mass change - global.svg - RCraig09

1979- Global sea ice extent (March).svg - RCraig09

1980- Rates of loss of global sea ice - months with smallest and largest rates.svg - RCraig09

20250419 Rates of loss of global sea ice - month by month - radar chart.svg - RCraig09