Wikimedi'Òc
Modes d'emploi

Cet album fait partie des albums
Cet album photos contient les sous-albums suivants :


European electricity grid.svg - Risto est

European electricity grid (hu).svg - Risto est

European union gdp diagram de.png - San Jose

European union gdp high diagram 2002 de.png - Wester

European union gdp 2002 low diagram de.png - Rony
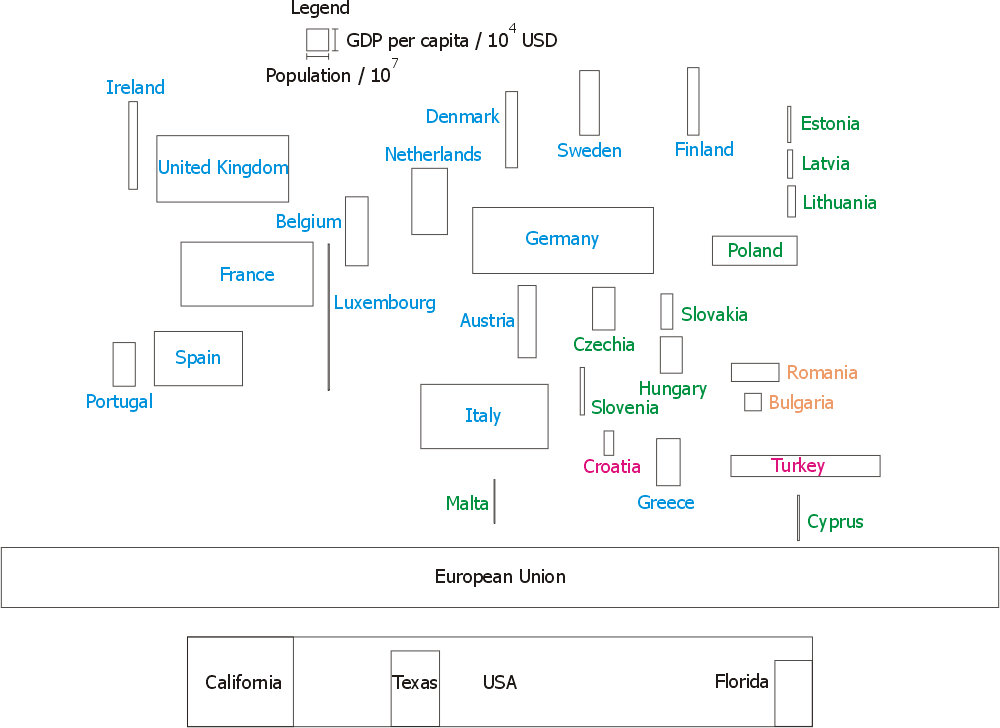
EU-GDP-Population.png - Kaihsu

EU-GDP-PPP.png - Barfoos

EU-GDP-PPP-pc.png - Barfoos
FarmlandinEU2.gif - Maksim

ACEA agreement progress.png - Jensbn~commonswiki

EU-GDP-Population.svg - Ytteroy

SEPA.PNG - Hektor Absurdus

Preissteigerung 1970-1980.png - Wikifreund

Europe economic space members.PNG - Jtpr92

EUFarm-eng.svg - File Upload Bot (Magnus Manske)
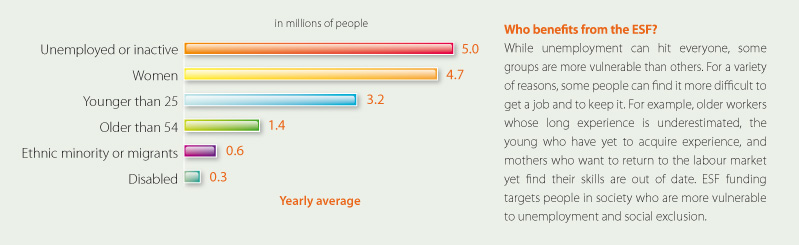
Who benefits from the ESF?.jpg - Blue semicolon
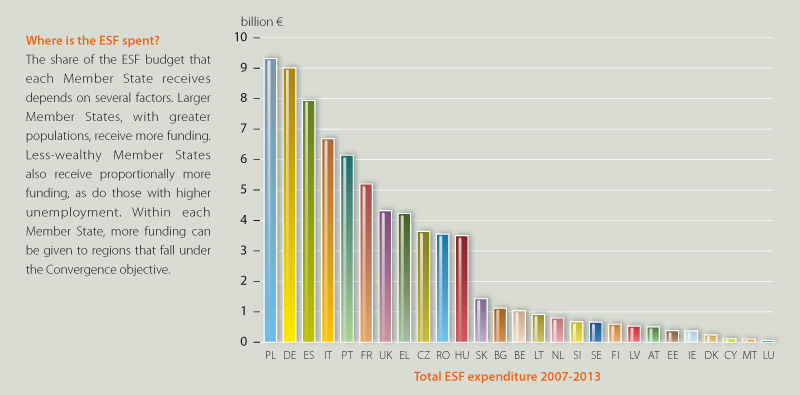
Graph 02 spending per country.jpg - Lhe78

NACE chooser.png - Zhangweiwu

Europäische Zollunion.svg - Sbb1413

PIGSmap.png - Pruxo

PIGSmap.svg - Iktsokh

Piiggs balance sheet 2009.png - Tóraí

Piiggs surplus 2002-2009.png - Spitzl

Piigs debt 2002-2009.png - K4Bugs

Piigs growth 2005-2009.png - Tóraí
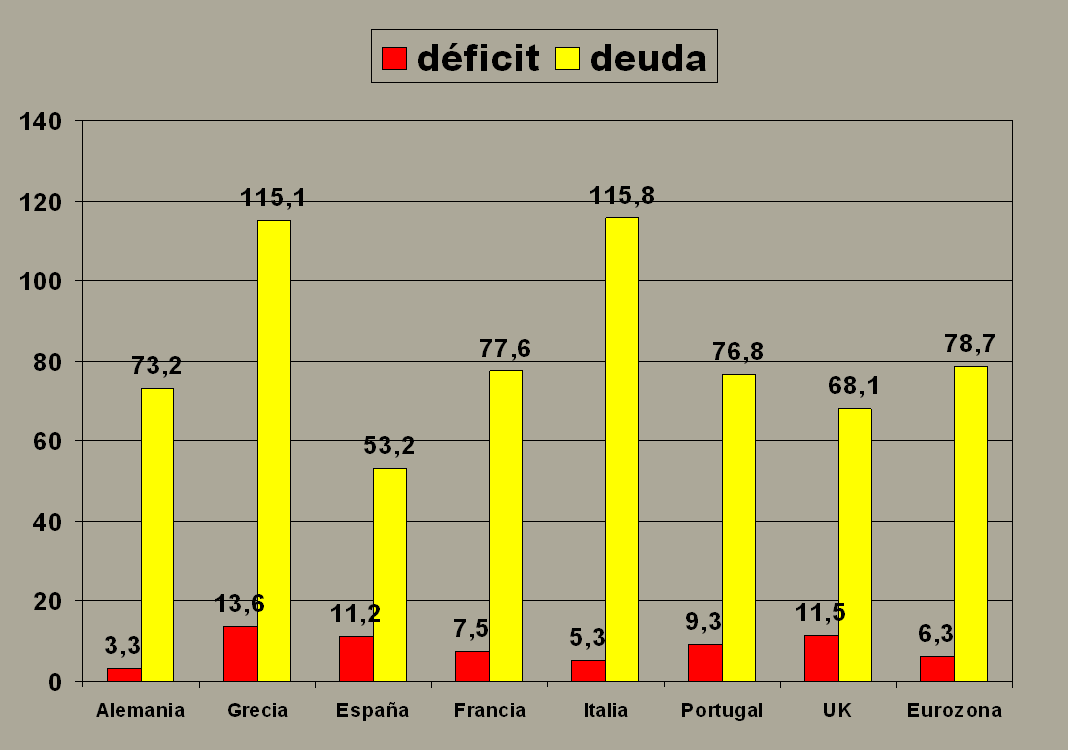
Deficites y endeudamiento de países de la eurozona in 2009.png - Pahpaha

Piiggs superávits 2002-2009.PNG - Pahpaha

EuropeanunionGDPpercapita.png - File Upload Bot (Magnus Manske)

Dette publique € par habitant 2010.JPG - Galuel

Dette publique PIB 2010.JPG - Galuel

Pommes de terre gm UE 2010.svg - Spedona

MoldovanGDPBySector.svg - PYX-340

Spanishdebt.jpg - Notsureifsrs

Government surplus or deficit since 2001 (piiggs and US).svg - Spitzl

Europäische Zollunion und Partnerstaaten.svg - Master Uegly

PIIGGSmap.svg - TAKASUGI Shinji

Taux TVA UE 07-2011.jpg - Touchatou

EU HDI 2011.svg - M.M.S.

Fisheryexpenditure2004.png - File Upload Bot (Magnus Manske)

Imports, exports, balance of EU trade in goods.JPG - Avidius

Gefühlte Inflation.svg - Hansbaer

Monthly unemployment rates EU.png - MartinD

EU quarterly current account.jpg - Avidius

Looking a gift horse in the mouth.png - Russavia

Unemployment rate United states - Europe 1993-2013.png - Amibreton

EuropeanunionGDPpercapita2.png - Keshetsven

EU Big 4 GNI Comparison.PNG - Jamesbloke

EU member states trade balance with Russia 2012.svg - Gavleson
Agrarium logo.png - GifTagger

Prix à la consommation en zone euro.PNG - Gagiiboli
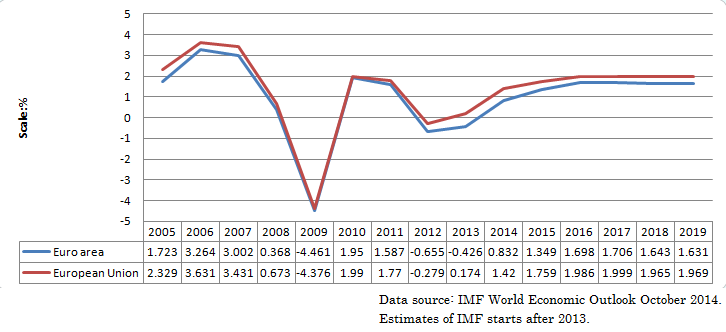
Graph of average growth rate of EU countries and Euro zone.png - ShuBraque

Exchange rate regime of EU countries according to Reinhart and Rogoff.png - ShuBraque

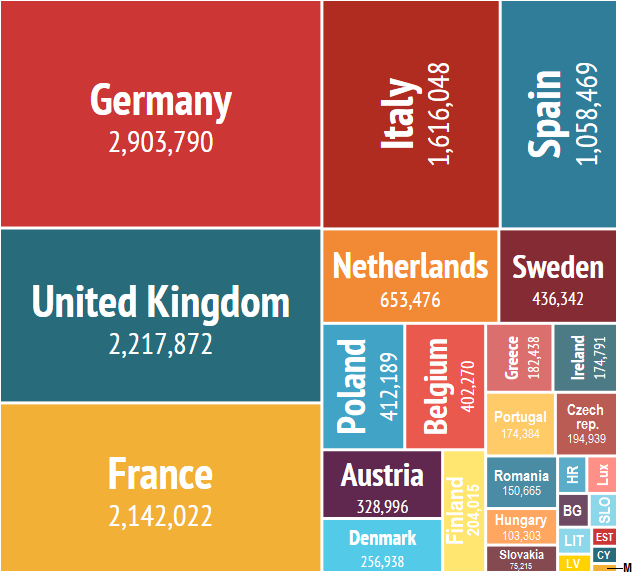
European-union-gdp-diagram-de.svg - Antonsusi

Europeanuniongdphighdiagramde.svg - Perhelion

Europeanuniongdplowdiagramde.svg - Perhelion
EU GDP.png - Jonas Henriksson

Gengov vs self.png - U rob me
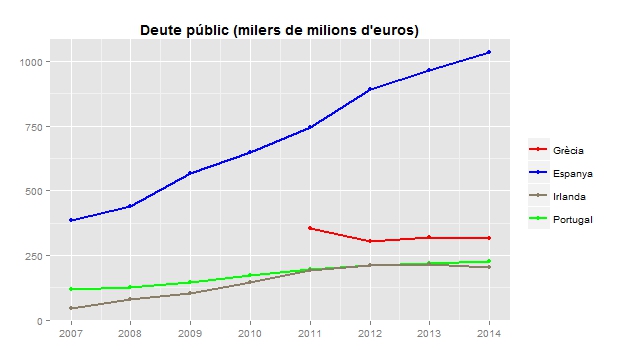
Deutepúblic.jpeg - Sajolida

Deutepublicspib.jpeg - Sajolida

The interrelatedness of the EU market.png - AntonioF.Amores
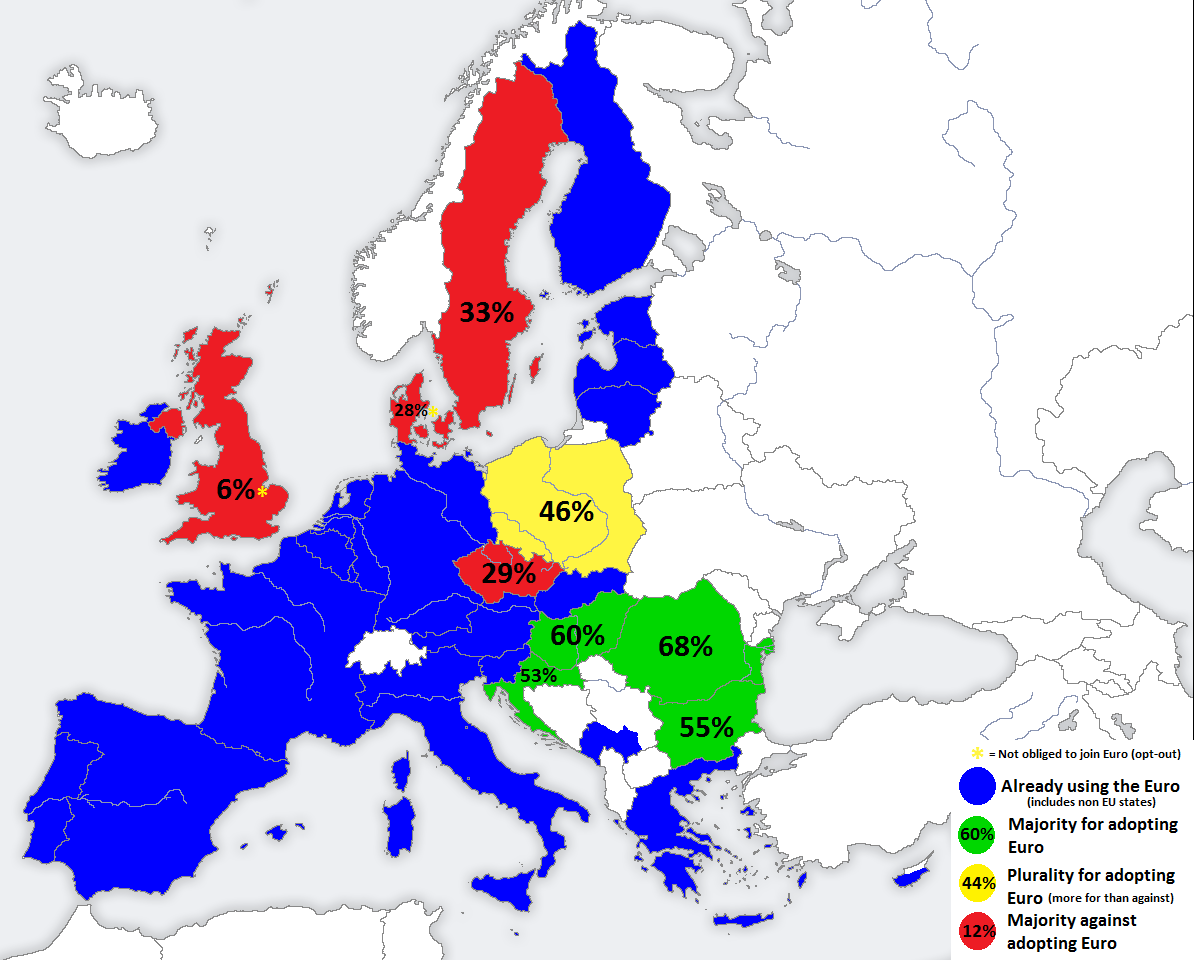
Supportforjoiningeuro.png - Ben Bezuidenhout

EU EFTA DCFTA EUCU.svg - Ibrahim Muizzuddin
Transfers-ue-pl.svg - Tbap

Member states' share of financing the UK rebate.png - Kavmeister

Eu-gateway-business-avenues-2016-2020-map-72dpi-RGB rev01.jpg - EU Gateway

Eu-gateway-business-avenues-1990-2020-timeline-72dpi-RGB.jpg - EU Gateway
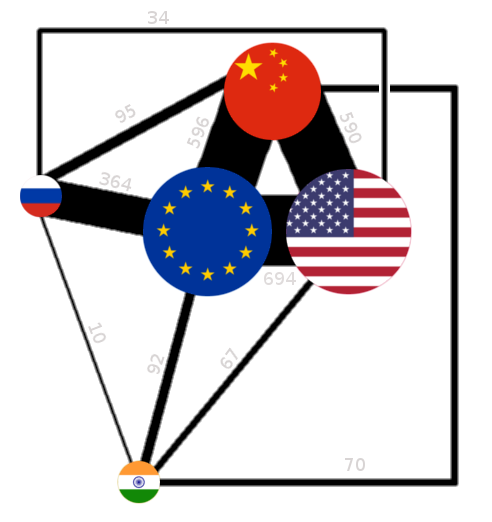
Economic connections between US, EU, China, Russia and India.png - Thereisnous

Eu handelsbilanz.svg - Kopiersperre

Balance commerciale de biens et services (Pays de L'Eurozone).gif - James 4

European Union Total Primary Energy Consumption in 2015.svg - Shahzad

Japan import from EU 2017.jpg - Thanatos509000

Japan eksport to EU 2017.jpg - Thanatos509000

Japan FDI in EU 2006-2016.png - Thanatos509000
Gini-income before transfers-comparison Croatia + neighboring countries - 2010-2017.svg - Bachlis
Gini-income after transfers-comparison Croatia and neighboring countries - 2010-2017.svg - Bachlis

Share of Top 10% on income in Croatia and the EU, 2010 - 2017.svg - Bachlis

Income Share of Top 10% in Croatia and the EU, 2010 - 2017.svg - Bachlis

Share of Top 10% in Croatia and neighbouring countries, 2010 - 2017.svg - Bachlis

Top10% Income Share PL CZ DE EU LT SK 2005-2017 EUSILC.svg - Bachlis

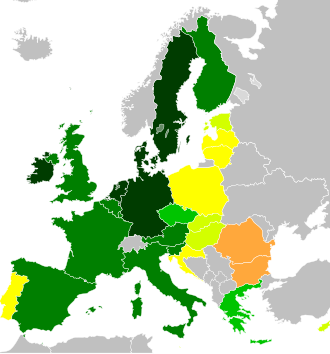
2019 GDP (nominal) in UE.png - Utryss

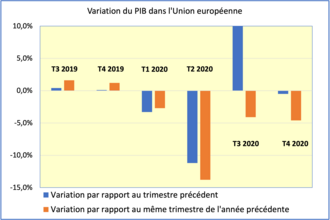
Variation PIB - GDP Union européenne.png - Denis-Paul Bourg

Car Sales Europe April 2020.png - Denis-Paul Bourg

Passenger Car Sales Europe May 2020.png - Denis-Paul Bourg

Passenger Car Sales Europe June 2020.png - Denis-Paul Bourg

Passagers aériens Europe janvier - juin 2020.png - Denis-Paul Bourg

Passagers aériens Europe 2019-2020.png - Denis-Paul Bourg
Répartition Budget UE 2000-2006 en %.png - Denis-Paul Bourg
Répartition budget UE 2007-2013 en %.png - Denis-Paul Bourg
Répartition budget UE 2014-2020 en %.png - Denis-Paul Bourg
Répartition Budget UE CFP 2000-2006 en %.png - Denis-Paul Bourg

PIB et Budget UE 2000 2019.png - Denis-Paul Bourg
Recettes budget UE répartition 2007.png - Denis-Paul Bourg
Recettes budget UE répartition 2014.png - Denis-Paul Bourg
Recettes budget UE répartition 2000.png - Denis-Paul Bourg
Recettes budget UE répartition 1988.png - Denis-Paul Bourg

Passenger Car Sales Europe September 2020.png - Denis-Paul Bourg

Variation PIB - GDP UE T3 2020.png - Denis-Paul Bourg

Renewable energy sources R&D expenditures of the EU MS from 1974 to 2015 and estimated until 2030 (Mil. EUR, BAU scenario).png - Prototyperspective

Renewable energy sources R&D expenditures of the EU MS from 1974 to 2015 and estimated until 2030 (Mil. EUR, Advanced scenario).png - Prototyperspective

Renewable energy sources R&D expenditures of the EC from 1987 to 2013 and estimated until 2030 (Mil. EUR, BAU scenario).png - Prototyperspective

Renewable energy sources R&D expenditures of the EC from 1987 to 2013 and estimated until 2030 (Mil. EUR, advanced scenario).png - Prototyperspective

Cumulative RES knowledge stock by public R&D expenditures of the EU MS (Mil. EUR, BAU scenario).png - Prototyperspective

Cumulative RES knowledge stock by public R&D expenditures of the EU MS (Mil. EUR, Advanced scenario).png - Prototyperspective

Cumulative RES knowledge stock induced by public R&D expenditures of the EC (Mil. EUR, advanced scenario).png - Prototyperspective

Cumulative RES knowledge stock induced by public R&D expenditures of the EC.png - Prototyperspective

Cumulative RES knowledge stock induced by public R&D expenditures of the EU MS and the EC.png - Prototyperspective

Cumulative RES knowledge stock induced by public R&D expenditures of the EC (Mil. EUR, BAU scenario).png - Prototyperspective

Variation PIB - GDP T4 2020.png - Denis-Paul Bourg

PKB w USD PPP najwiekszych gospodarek jako odsetek PKB swiata.svg - Ra.sz.

Passenger Car Sales Europe December 2020.png - Denis-Paul Bourg

Europe minimum wage 2021.png - Рагин1987

Europe tax rates.svg - Martin Tauchman

Top Marginal Tax Rates In Europe.webp - Wikideas1
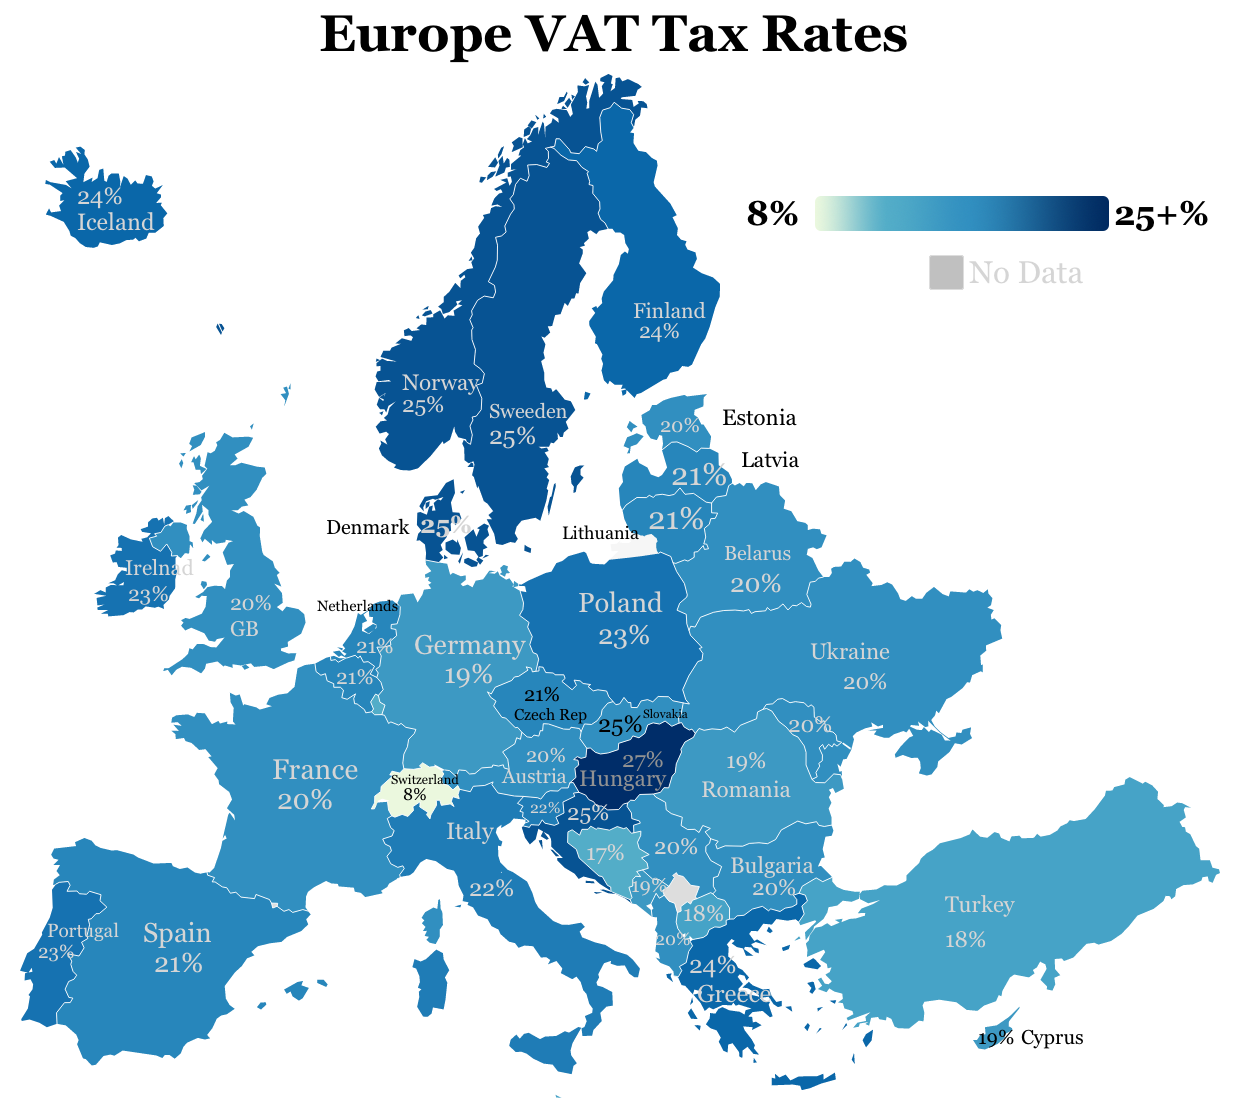
European VAT Tax Rates.webp - Wikideas1

Information sign about european union project (Cerbona Élelmiszergyártó Zrt.).jpg - Oruwachichin

Euro to Swiss Franc exchange rate.webp - Wikideas1

EU Countries as per Annual GDP (2022) (HY).jpg - Maria Hayrapetyan
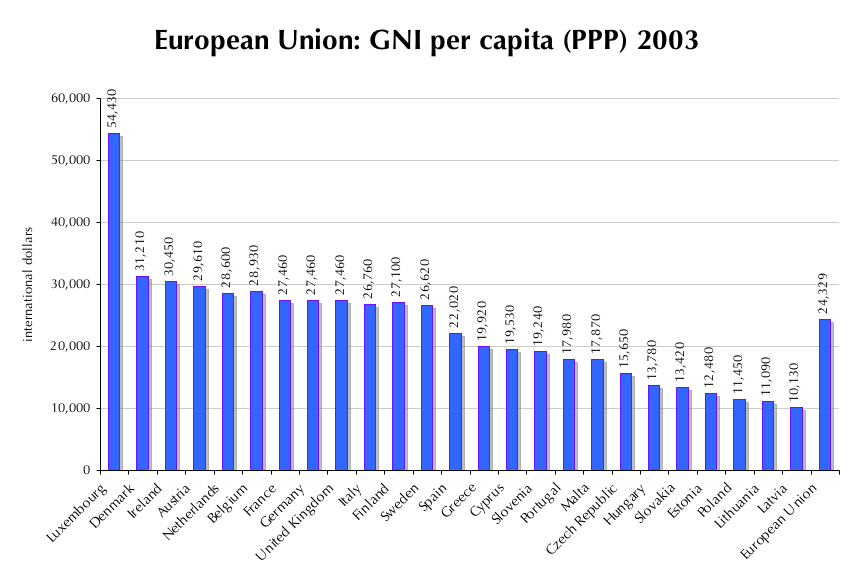
EU gross national income per capita (purchasing power parity) 2003.png - Cantus