Wikimedi'Òc
Modes d'emploi

Cet album fait partie des albums
Cet album photos contient les sous-albums suivants :


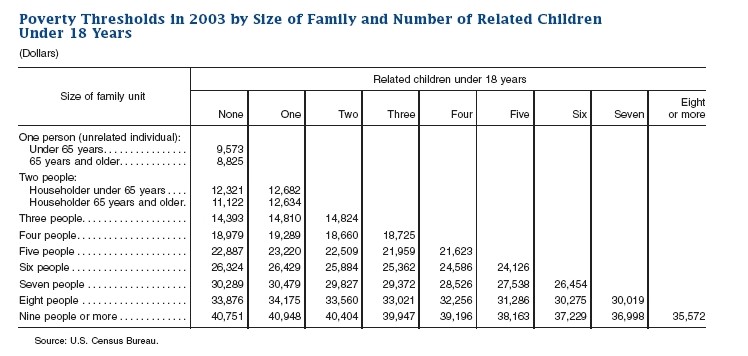
Povertythresholds-census2003.jpg - RTCEarly
Uspopclock300million.png - Aude
Bxmuralmh.JPG - Wikiwiki718~commonswiki
DREAM Act.jpg - Cjxxi
Homework.jpg - Azaliaadeyemo

InStateTuiton.jpg - Itzyisrad

US-center-pop.jpg - Jbarta

Center of population 2162923483 f183ac07bc o.jpg - Rootless Cosmopolitan

PSM V78 D419 Us population increase between 1650 to 1900.png - Ineuw

PSM V78 D420 Total population percentage of us cities of 8000 and over.png - Ineuw

Croissance des zones "métropolitaines" 1900-1940.jpg - Lucie.germain

Proj8.svg - Cmunsterman

PSM V63 D183 Decrease in the size of the american family.png - Ineuw
Pt-Problemas sociais dos Estados Unidos.ogg - DAR7

Demographics of Youth in America.png - Ayoubjes

Graph us population 1790 2010.gif - Jumpytedhey

U.S. Labor Force and Employment to Population Ratios.png - Bender235

US state historical population FRED SMIL.svg - Tcr25

US percent of births by age of mother and marital status.svg - Delphi234

US percent of births by age of mother and marital status in 1990.svg - Delphi234

US percent of births by age of mother and marital status in 2010.svg - Delphi234

US percent of births by age of mother and marital status in 2000.svg - Delphi234
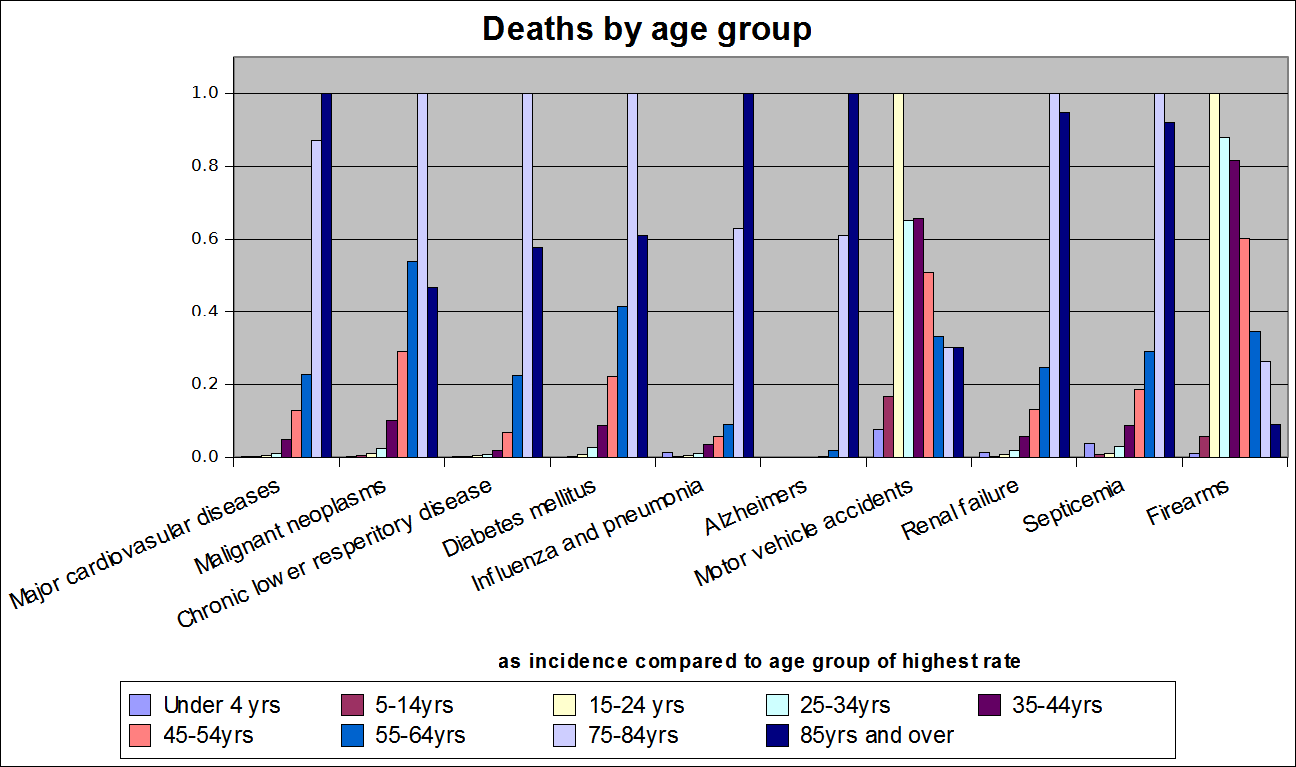
Deaths by age group fixed.png - 84user

PSM V63 D177 PSM Marriage rate of college graduates.png - Ineuw

PSM V63 D179 Death rate in professional families and laboring classes.png - Ineuw

PSM V63 D187 Reproduction of class and race.png - Ineuw

Birthratechart.gif - FastilyClone

Circular- "Americans! Wake Up!", September 1920.jpg - Fæ

Population-evolution--united-states-of-america.svg - Ferranvel
Guatemalan Foreign Born Migration Trends.pdf - TruedSoul

Center of population LCCN2014689694.jpg - Fæ

Thai-US Citizen Population over time.png - Tdangsangtong

Distribution of US and CA households by income relative to CE poverty lines.png - Seaplant

US Census Two or More Races.png - Dalta
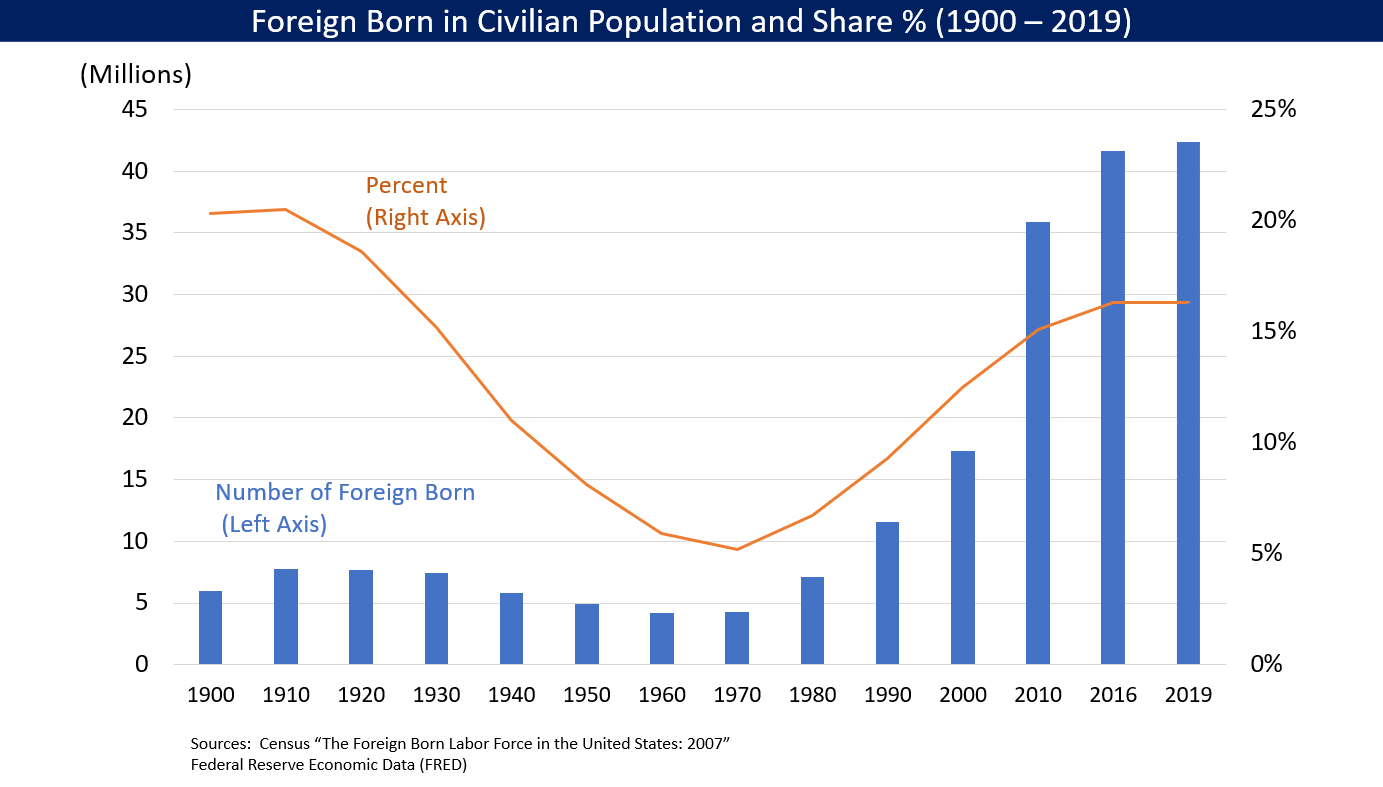
Foreign Born in U.S. Number and Share 1900-2019.png - Farcaster

US births demographic cohorts.png - Nerd271

US living adult generations.png - Nerd271
A century of population growth from the first census of the United States to the twelfth (IA centuryofpopulat00unit).pdf - Fæ

Infant mortality in selected countries and regions since 1950.svg - DavidMCEddy

Ethnic Composition of Americans Under 15.png - Nerd271

Ethnic Composition of US Cohorts.png - Nerd271

Working age population - China, United States.svg - Normchou

U.S. Population 1900–2016, Population Projections 2017–2060 by Immigration Scenario.jpg - Raquel Baranow

U.S. Population 1900–2016, Population Projections 2017–2060 by Immigration Scenario (cropped).jpg - Raquel Baranow

Percentage of the U.S. Population That Is Foreign-Born 1850 to 2016 Projected 2017 to 2060.jpg - Raquel Baranow

Projected Hispanic Population in the United States 2020 to 2060.jpg - Raquel Baranow

Percentage of the U.S. Population That Is Foreign-Born 1850 to 2016 Projected 2017 to 2060 (cropped).jpg - Raquel Baranow

Projecting Majority-Minority in the United States.jpg - Raquel Baranow

Racial Ethnic Composition Children United States 2016 2060 Projections.jpg - Raquel Baranow
Racial Ethnic Composition of the United States 1970 2050 (cropped).png - Raquel Baranow

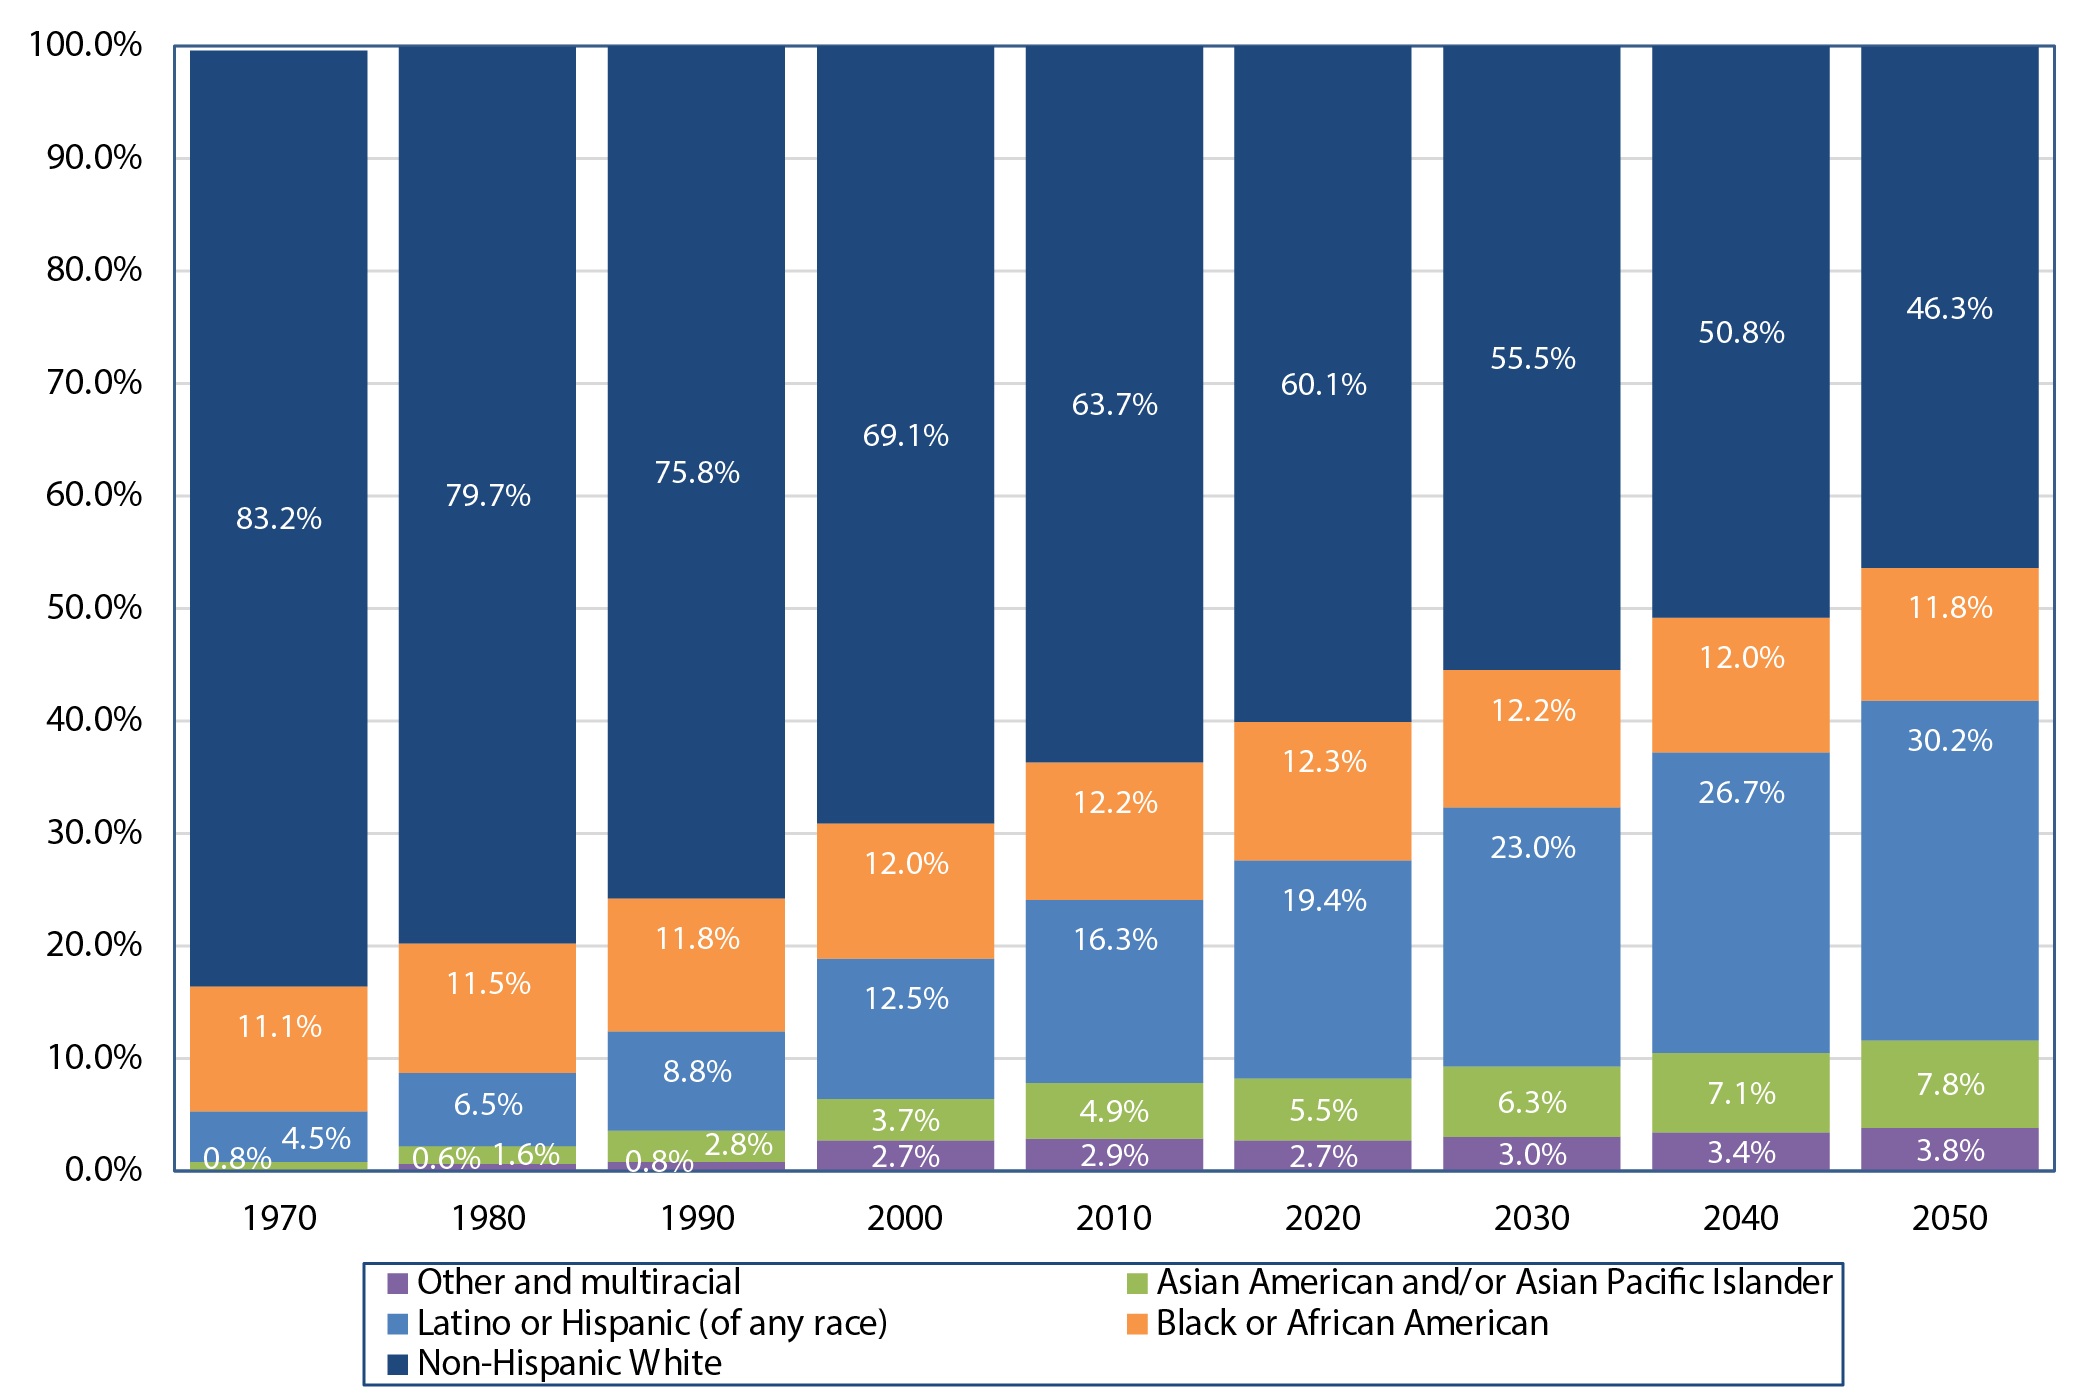
Racial Ethnic Composition of the United States 1970 2050.jpg - Raquel Baranow

White America (of one race) from 1960 to 2020.gif - Tweedle

United States population pyramid overtime from 1950 to 2020.gif - Tweedle

Fertility rate of the United States from 1820 to 2016.svg - Tweedle

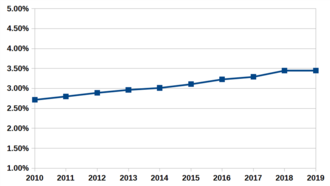
Trends in Poverty Rates by Ages in the US 1966-2021.png - Rcragun

Projected US Population by Immigration Scenario 2016 to 2060.jpg - Raquel Baranow

Percentage of women childless by age cohort in the US.svg - Tweedle

Median age at first marriage in the US.svg - Tweedle

Percentage of men and women who have never married aged 15 and older in the US.svg - Tweedle

One person households in the US over time.svg - Tweedle

Single parents in the US over time from 1950 to 2020.svg - Tweedle

Complete history of the Racial and ethnic demographics of the United States in percentage of the population.svg - Tweedle

Non-Hispanic White population pyramid 2021.svg - Tweedle

Hispanic population pyramid 2021.svg - Tweedle

Foreign born population percentage in the US.svg - Tweedle

Black Americans population pyramid in 2020.svg - Tweedle

Hispanic Whites population pyramid in 2020.svg - Tweedle

Two or more races population pyramid in 2020.svg - Tweedle

White Americans population pyramid in 2020.svg - Tweedle

Non-Hispanic Black Americans population pyramid in 2020.svg - Tweedle

Asian Americans population pyramid in 2020.svg - Tweedle

Hispanic Americans population pyramid in 2020.svg - Tweedle

Non-Hispanic White Americans population pyramid in 2020.svg - Tweedle

American Indian and Alaskan Native population pyramid in 2020.svg - Tweedle

Non-Hispanic White population pyramid from 1990 to 2020.gif - Tweedle

Non-Whites in the US population pyramid in 2020.svg - Tweedle

US Race by Hispanic origin demographics from 1940 to 2020.gif - Tweedle

Ethno-racial makeup of the United States by single year ages in 2020.svg - Tweedle

US Race by Hispanic origin age demographics from 1990 to 2020.gif - Tweedle

Salario medio annuo in dollari.png - Lovepeacejoy404

Immigration to the United States over time by region.svg - Tweedle

Immigration to the United States over time.svg - Tweedle

Population pyramid of the United States by race-ethnicity in 2020.svg - Illchy

US population pyramid by race in 1970.svg - Tweedle
Public Release of the Annual Demographic Report - Hiring and Retention of Minorities, Women, and Persons with Disabilities in the United States Intelligence Community Fiscal Year 2015.pdf - VGPaleontologist

USA Contiguous Population Over 65 2020.jpg - GeogSage
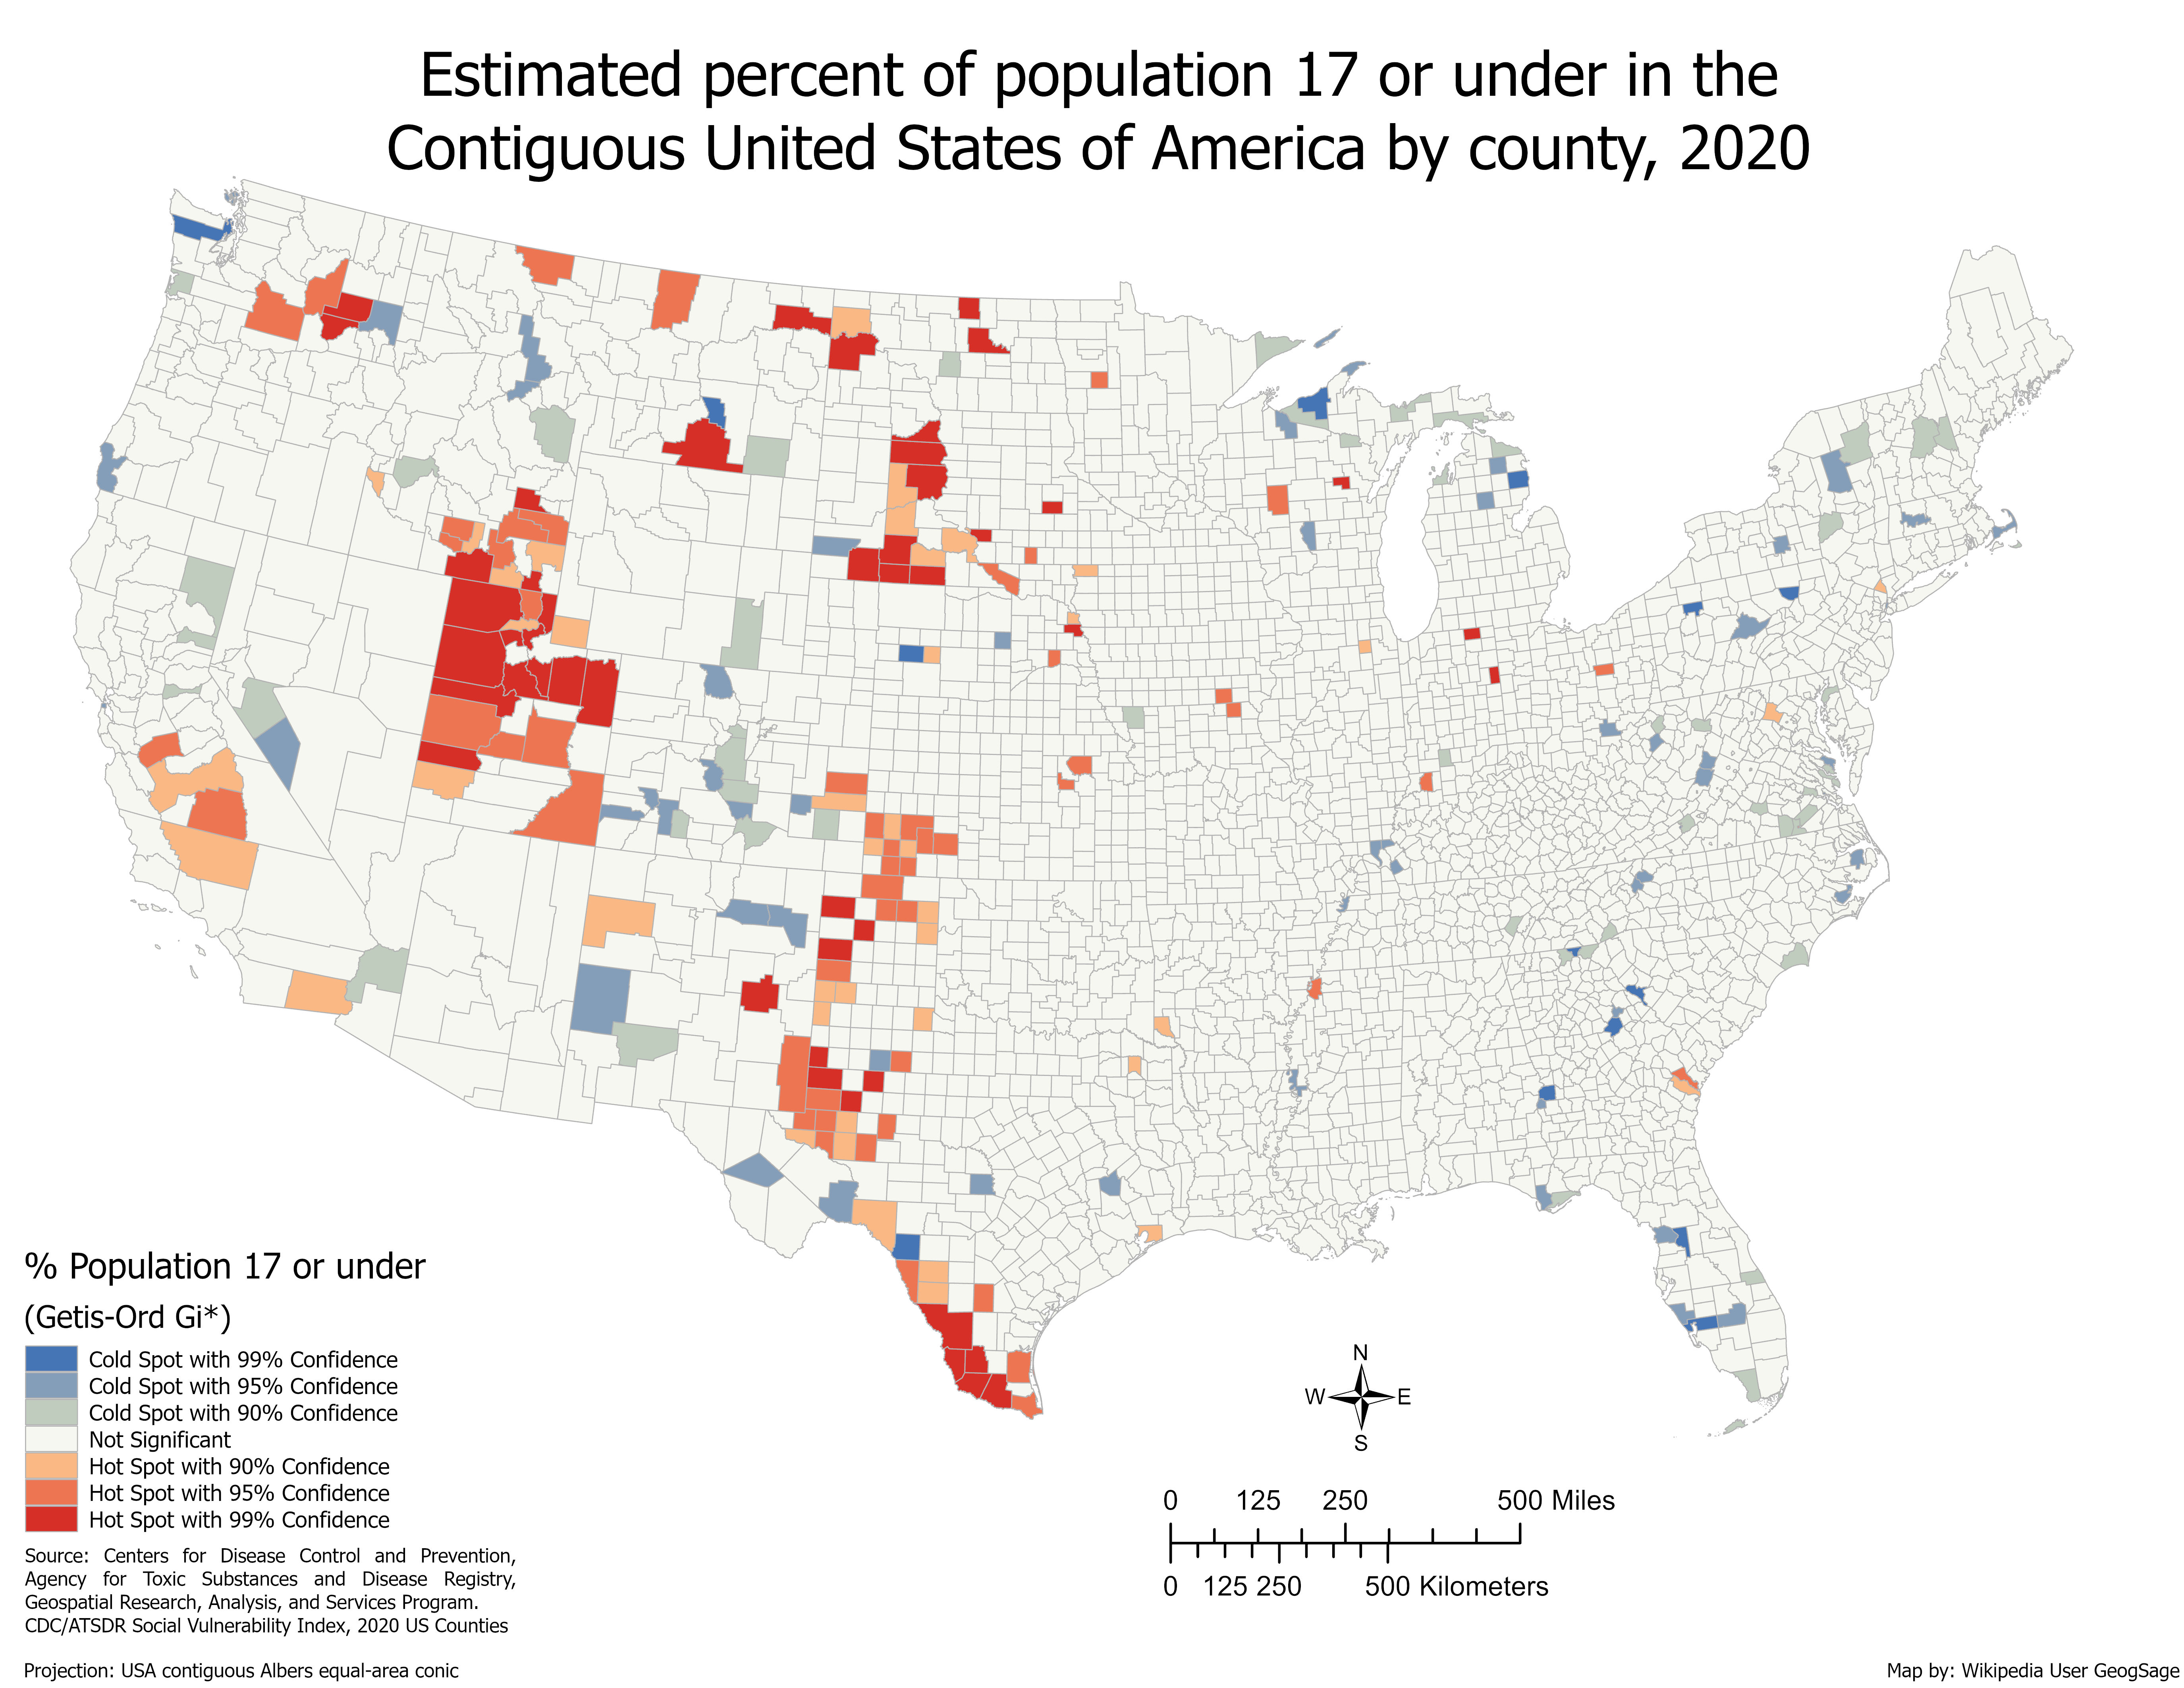
USA Contiguous PopulationUnder17 2020.jpg - GeogSage

USA Contiguous Unemployment Rate 2020.jpg - GeogSage

USA Contiguous PopulationwithoutInternet 2020.jpg - GeogSage

Comparison of ages in the Contiguous United States by county, 2020.jpg - GeogSage

USA Contiguous Poverty 2020.jpg - GeogSage

USA Contiguous NoHighschool 2020 Hotspot.jpg - GeogSage

USA Contiguous PopulationwithoutInsurance 2020.jpg - GeogSage

Estimated percentage of housing units with more people then rooms in counties in the Contiguous United States of America, 2020.jpg - GeogSage

Estimated percentage of people below 150% poverty in Contiguous United States Counties, 2020.jpg - GeogSage

Total population versus exposed population by 2050 for different racial demographics on the US coast.webp - Prototyperspective

Percentage of people with a high school degree or higher as of 2018.png - Dashing24

Slavery in a Growing Nation - President's House Site 2022-06 (74).jpg - Kreuz und quer