Wikimedi'Òc
Modes d'emploi

Cet album fait partie des albums
Cet album photos contient les sous-albums suivants :

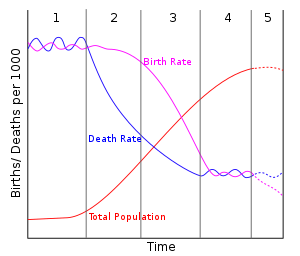


Demographictransition.jpg - RTCEarly
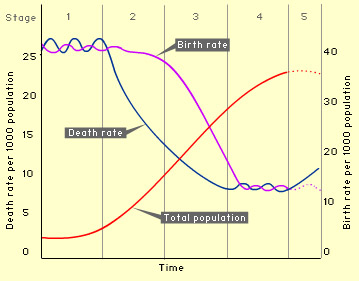
Stage5.jpg - Grillo
Transition démographique.svg - Walké

Stage5.svg - Ата

DemogRussia.png - Ghsmith19
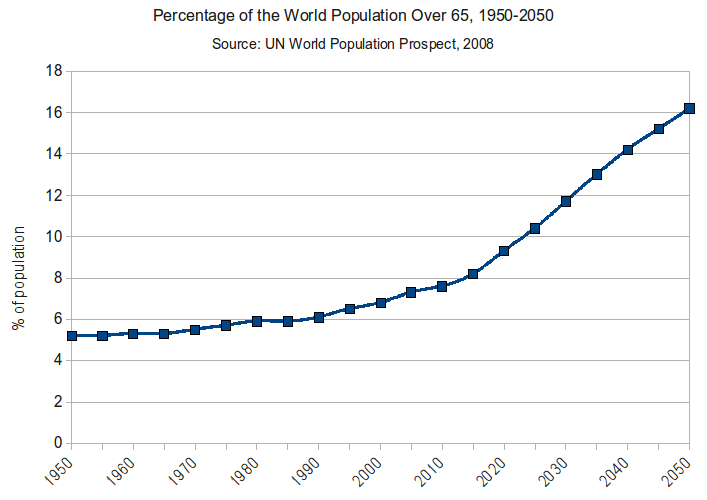
Percentage of the World Population Over 65 - 1950-2050.png - Rcragun
Demographic Transition010.jpg - Rotatebot

Stages of DTM (ru).svg - Ain92
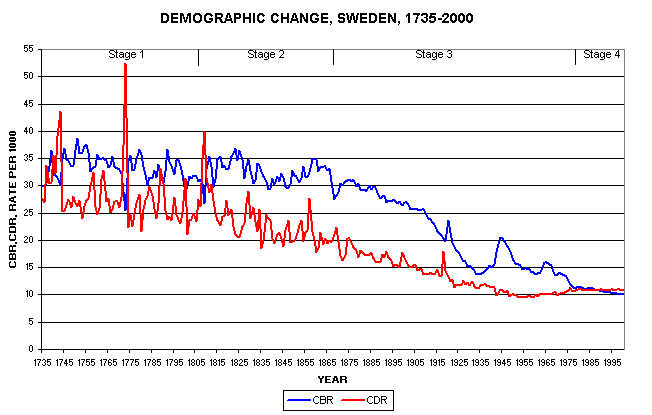
Demographic change in Sweden 1735-2000.png - GifTagger
Demographic-Transition-5-countries.png - Beao
Demographic-TransitionOWID.png - علاء الدين

Age dependency breakdown by young and old dependents, OWID.svg - Fæ

Age dependency ratio, OWID.svg - Fæ

Age dependency ratio projected to 2100, OWID.svg - Fæ
The Demographic Transition, OWID.svg - Fæ

U.S. Population 1900–2016, Population Projections 2017–2060 by Immigration Scenario.jpg - Raquel Baranow

U.S. Population 1900–2016, Population Projections 2017–2060 by Immigration Scenario (cropped).jpg - Raquel Baranow

Percentage of the U.S. Population That Is Foreign-Born 1850 to 2016 Projected 2017 to 2060.jpg - Raquel Baranow

Projected Hispanic Population in the United States 2020 to 2060.jpg - Raquel Baranow

Percentage of the U.S. Population That Is Foreign-Born 1850 to 2016 Projected 2017 to 2060 (cropped).jpg - Raquel Baranow

Projected US Population by Immigration Scenario 2016 to 2060.jpg - Raquel Baranow

Number of conditions ever recorded per individual (from 308 health conditions), stratified by age, sex, and ethnicity.jpg - Prototyperspective

Global aging demographics.webp - Prototyperspective

Median Age, global scale, 2021.png - SamuelSThomas

Median Age, 1950-2100.png - SamuelSThomas
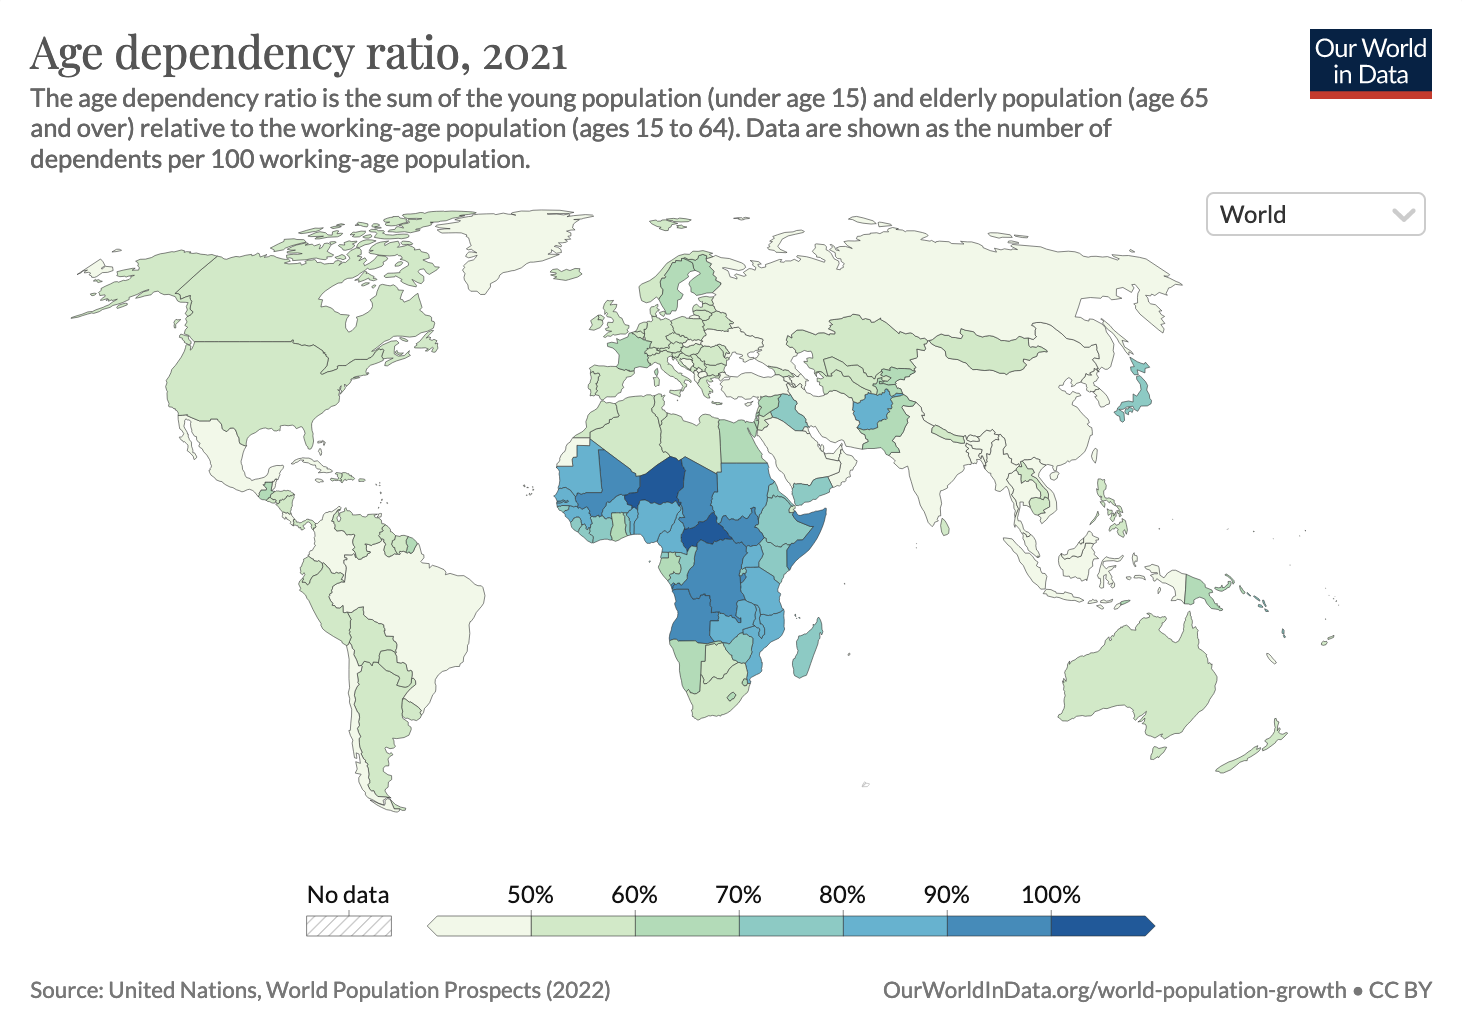
Age Dependency Ratio, 2021.png - SamuelSThomas
Transizione demografica schema1.png - Saxings