Wikimedi'Òc
Modes d'emploi

Cet album fait partie des albums
Cet album photos contient les sous-albums suivants :
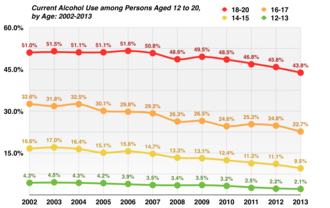


2002-2013 Alcohol Use among Persons Aged 12 to 20, by Age - United States.png - ZiaLater

Alkohol Jugendliche.svg - Achim55

Hard liquor consumption.svg - Phoenix7777

PRB-2017- Percent of Secondary School Students Ages 13-15 Who Currently Use Alcohol or Tobacco Products, or Are Overweight or Obese, by Gender.jpg - Population datasheet

Preventable Causes of Cancer in US.png - Bernstein0275

Alcohol consumption by tourists, OWID.svg - Fæ

Alcohol consumption by type of alcoholic beverage, OWID.svg - Fæ

Alcohol consumption per capita (Per capita alcohol consumption in high-income countries), OWID.svg - Fæ

Alcohol consumption vs. GDP per capita, OWID.svg - Fæ

Alcohol expenditure in the US since 1935, OWID.svg - Fæ

Average alcohol consumption by 15-19 year old males vs females, OWID.svg - Fæ

DALY rates from alcohol use disorders by age, OWID.svg - Fæ

Mental health as a risk factor for alcohol dependency or abuse, OWID.svg - Fæ

Number of people with alcohol use disorders, OWID.svg - Fæ

Number of people with alcohol use disorders by region, OWID.svg - Fæ

Prevalence of alcohol use disorders by age, OWID.svg - Fæ

Prevalence of alcohol use disorders in males vs. females, OWID.svg - Fæ

Share of alcohol in total household consumption, OWID.svg - Fæ

Share of men vs. share of women who drank alcohol in last year, OWID.svg - Fæ

Share of people with alcohol use disorders receiving treatment, OWID.svg - Fæ

Share of population with alcohol use disorder vs. alcohol consumption, OWID.svg - Fæ

Share of consumer expenditure spent on alcoholic beverages and tobacco vs. GDP per capita, 2015, OWID.svg - Fæ

Alcohol consumption per person, 1, OWID.svg - Fæ

DALYs (Disability-Adjusted Life Years) rate from alcohol and drug use disorders, OWID.svg - Fæ

Deaths from substance use disorders by age, OWID.svg - Fæ

Deaths from tobacco, alcohol and drugs, OWID.svg - Fæ

Number of deaths from alcohol and drug use disorders, OWID.svg - Fæ

Number of deaths from substance use disorders, OWID.svg - User-duck

Number of people with alcohol or drug use disorders, OWID.svg - Fæ

Number of people with alcohol or drug use disorders, 1, OWID.svg - Fæ

Share of population with alcohol use disorder vs. drug use disorder, OWID.svg - Fæ

Share with alcohol or drug use disorders, men vs. women, OWID.svg - Fæ

Alcohol-consumption-per-person-us.png - Ozzie10aaaa

Share-of-alcohol-in-total-household-consumption.png - Ozzie10aaaa

Males-vs-females-who-drank-alcohol-in-last-year.png - Ozzie10aaaa

Share-with-alcohol-use-disorder-vs-alcohol-consumption.png - Ozzie10aaaa

Alcohol-use-disorder-vs-alcohol-consumption.png - Ozzie10aaaa

Alcohol-consumption.png - Ozzie10aaaa