Wikimedi'Òc
Modes d'emploi

Cet album fait partie des albums


NOAA ACE index 1950-2004 RGB.svg - Mats Halldin~commonswiki

NOAA ACE index 1950-2004 BW.svg - Mats Halldin~commonswiki

Ace storm atlantic 1950-2006.png - Pierre cb

Ace storm atlantic 1950-2006 fr.png - Pierre cb
Hist east pac ace trend 1971-2007.gif - Bender235

ACE Wert 1851-2007.png - File Upload Bot (Magnus Manske)

Atlantic ace timeseries 1850-2007 fr.svg - Pierre cb

Atlantic ace timeseries 1850-2007 fr..png - Pierre cb

Atlantic ace timeseries 1850-2011 fr.svg - Pierre cb

Hurrikansaison-Intensität 1851-2007 2.svg - OgreBot
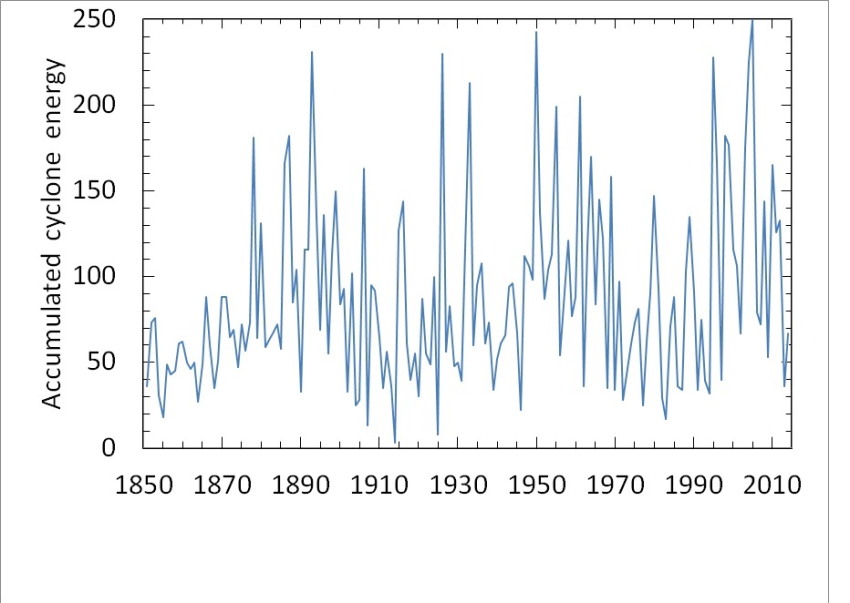
Atlantic ace timeseries 1850-2014.jpg - Spiffy sperry

ACE Index 1948-2014.svg - Pierre cb

Atlantic ace timeseries 1850-2016.svg - Bender235
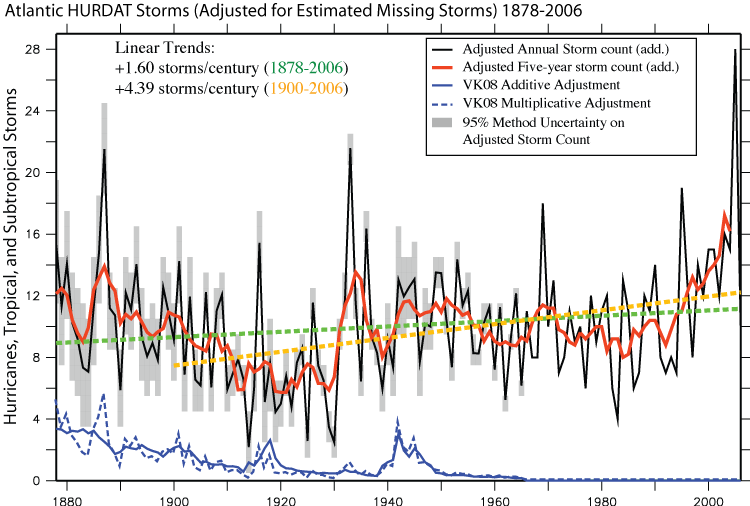
Adjusted Tropical Storm Count.png - Titanium Dragon

North Atlantic Tropical Cyclone Activity According to the Accumulated Cyclone Energy Index 1950–2015.png - Adakiko

Atlantic ace timeseries 1850-2016 fr.svg - Pierre cb

Accumulated Cyclone Energy of North Atlantic hurricanes, OWID.svg - Cptmrmcmillan

Accumulated Cyclone Energy of North Atlantic hurricanes, OWID multilingual.svg - Pierre cb

2024 Accumulated Cyclone Energy Index compared to 30-year average.svg - RCraig09